If you’re an Airbnb host, especially in a competitive market, you already know that a stand-out listing is key to success. That’s why knowing how to optimize your Airbnb listing is so important – even small improvements can lead to more property rentals and, therefore, more revenue.
One way to improve your listings is by A/B testing. A/B testing means testing two versions of your listing against each other to identify which one appeals to potential guests more. Whether it involves changing the headline, editing the description, or swapping images, the goal is to present the most appealing version of your listing to your audience, ultimately increasing your conversion and occupancy rates.
In this post, we’ll cover the benefits of A/B testing, how to use it to optimize your Airbnb listings, and some examples and tips for getting started.
Why is optimizing your Airbnb listing important?
As a savvy Airbnb host, you want to ensure your listing is reaching its full potential for attracting guests so you can maintain a steady stream of bookings. A/B testing is one simple but effective way to achieve that goal.
Benefits of A/B testing Airbnb listings
A/B testing allows you to compare two different versions of your listing’s elements, such as headlines, descriptions, and images, to determine which one performs better. By continually refining and improving your listing through data-driven insights, you’ll reap significant benefits, including:
- Increased visibility: a well-optimized listing is more likely to rank higher in Airbnb’s search results, making it more visible to potential guests.
- Enhanced booking rate: a listing that appeals to your target audience will have a higher chance of converting page views into actual bookings.
- Improved guest satisfaction: by addressing the needs and preferences of your target audience, you’ll create a more satisfying experience for your guests, leading to positive reviews and repeat bookings.
Common reasons for poor Airbnb performance
Several factors can contribute to a subpar Airbnb listing, including:
- Unattractive or unclear images: poor-quality photos or images that don’t showcase your space effectively can deter potential guests.
- Ineffective descriptions: a confusing or unappealing listing description can fail to convey the unique selling points of your property.
- Pricing issues: overpricing or underpricing your listing can drive away potential guests or lead to a poor return on your investment.
What are the most important elements in an Airbnb listing?
Images
High-quality images that accurately represent the property are crucial for attracting potential guests and encouraging them to book. It’s important to use photos that showcase the most appealing aspects of the property.
Listing description
It’s important to provide a detailed and accurate listing description that provides potential guests with all the information they need to make an informed decision. But the description also needs to sell the property and should highlight its unique features, such as the amenities, location, and nearby attractions.
Pricing
Setting a competitive price that reflects the value of the property is important for attracting potential guests. It’s important to research the local market and set a price that is comparable to similar properties in the area. (But that doesn’t mean your price should always be lower than the competition!)
Reviews and ratings
Positive reviews and ratings from previous guests can go a long way in convincing potential guests to book. It’s important to encourage guests to leave reviews and respond to any negative reviews in a professional and helpful manner.
Availability
Keeping the availability and booking calendar up-to-date is essential for managing guest expectations and avoiding cancellations or double bookings.
Personalization
Adding personal touches to the listing (such as welcome notes or local recommendations) can help create a memorable experience for guests, leading to positive reviews and increased bookings.
While some of these areas require more time and effort to improve (such as reviews), your images and listing descriptions can be quickly and easily tested and optimized.
How does A/B testing for Airbnb work?
A/B testing involves creating two versions of your listing (Version A and Version B), each with one specific element altered. You then show your target audience each version and track how well each one performs, using predetermined metrics like click-through rate or booking rate.
It’s important to only test one aspect at a time, like a new main image or headline, instead of changing multiple elements at once. That way, you’ll know exactly which one guests prefer.
Once you’ve collected enough data, you’ll be able to identify which version performed better and use the winning element in your listing. By continuously testing and iterating, you can optimize your Airbnb listing for maximum success. PickFu makes A/B testing your Airbnb listing a breeze. Unlike traditional A/B testing, where you edit your listing directly and wait for results, PickFu enables you to test various listing elements with your target audience and get high-quality feedback quickly – without having to make changes to your live Airbnb listing first.
Conversion rate vs. occupancy rate
Conversion rate is the percentage of guests who book a property after viewing the listing. It is the ratio of the number of bookings to the number of listing views.
For example, if a listing receives 100 views and 2 bookings, the conversion rate would be 2%.
Occupancy rate is the percentage of time that a listing is booked or occupied. It is the ratio of the number of booked nights to the number of available nights.
For example, if a listing is available for 30 nights in a month and is booked for 12 of those nights, the occupancy rate would be 40%.
In 2021, the average stay on Airbnb was about 4.5 nights. If you’re aiming for 40% occupancy, that means your property has to be booked for 12 nights per month. By dividing 12 nights total by 4.5 nights per stay, we find that you’ll need two to three bookings per month to hit your goal.
Let’s do the math
One case study on Unbound Investor estimates that the average Airbnb host can maintain a 40% occupancy with around 200 listing views per month. We’ll use those numbers as a starting point for answering these questions:
- How much do you have to increase the listing performance to reach 60% occupancy?
- At 60% occupancy, what would be the increase in revenue for a property costing between $60-450 USD per night?
Assuming a 30-day month, a 40% occupancy rate, and the nightly rates of $60, $120, $200, and $450, we can calculate the starting revenue as follows:
| Nightly rate | Revenue |
| $60 | $720 |
| $120 | $1440 |
| $200 | $2400 |
| $450 | $5400 |
If we increase the occupancy rate to 45%, the revenue earned would increase as well, assuming all other factors remain constant. Using the same formula as before, we can calculate the new revenue for each nightly rate:
| Nightly rate | Revenue | Increase |
| $60 | $810 | $90 |
| $120 | $1620 | $180 |
| $200 | $2700 | $300 |
| $450 | $6075 | $675 |
As we can see, even a 5% increase in occupancy rate can lead to a big increase in revenue.
If the occupancy rate increases to 60%, assuming all other factors remain constant, the revenue earned by the property would increase even more significantly:
| Nightly rate | Revenue | Increase |
| $60 | $1080 | $360 |
| $120 | $2160 | $720 |
| $200 | $3600 | $1200 |
| $450 | $8100 | $2700 |
Now, let’s look at the conversion rate you need to get to these numbers.
We’ve established that you need two to three bookings per month to reach a 40% occupancy rate and make about $2000 in revenue. With 200 monthly listing views, you need a 1.5% conversion rate to get three bookings (1.5% of 200 = 3).
To reach a 60% occupancy rate at 4.5 nights per booking, you’ll need four bookings per month (4 bookings * 4.5 nights per booking = 18 days. 18 days out of 30 day month = 60%).
If the number of listing views stays the same at 200 per month, you’ll need to increase your conversion rate to 2%.
This might sound easy – it’s only 0.5 percentage points after all. But relatively speaking, this means a 33% hike. A 2% conversion rate is still achievable and is considered to be a good number for a lot of hosts. According to Unbound Investor, hosts are reporting conversion rates anywhere from 0.5% to 3% on average.
So how do you actually increase your conversion rate?
It’s important to note that achieving a 60% occupancy rate can be challenging and requires continual optimization of your listing, including the description, images, pricing, and reviews. Hosts should regularly monitor their listing’s performance to identify areas for improvement and make data-driven decisions to generate more bookings.
But to answer the question – by doing several A/B tests to find the perfect combination of titles, images, descriptions, and other listing variables, you can achieve your target conversion and occupancy rates.
Getting started with A/B testing
Which listing elements should I test?
Here are some key parts of your Airbnb listing that you should consider A/B testing.
Listing title
Experiment with titles that highlight different features or selling points of your property. A captivating title can pique a potential guest’s interest and entice them to click and explore your listing further.
Listing description
Test different writing styles, lengths, or focuses in your description to determine which version resonates best with your target audience. A well-crafted description should clearly communicate essential details while creating a vivid picture of the guest experience.
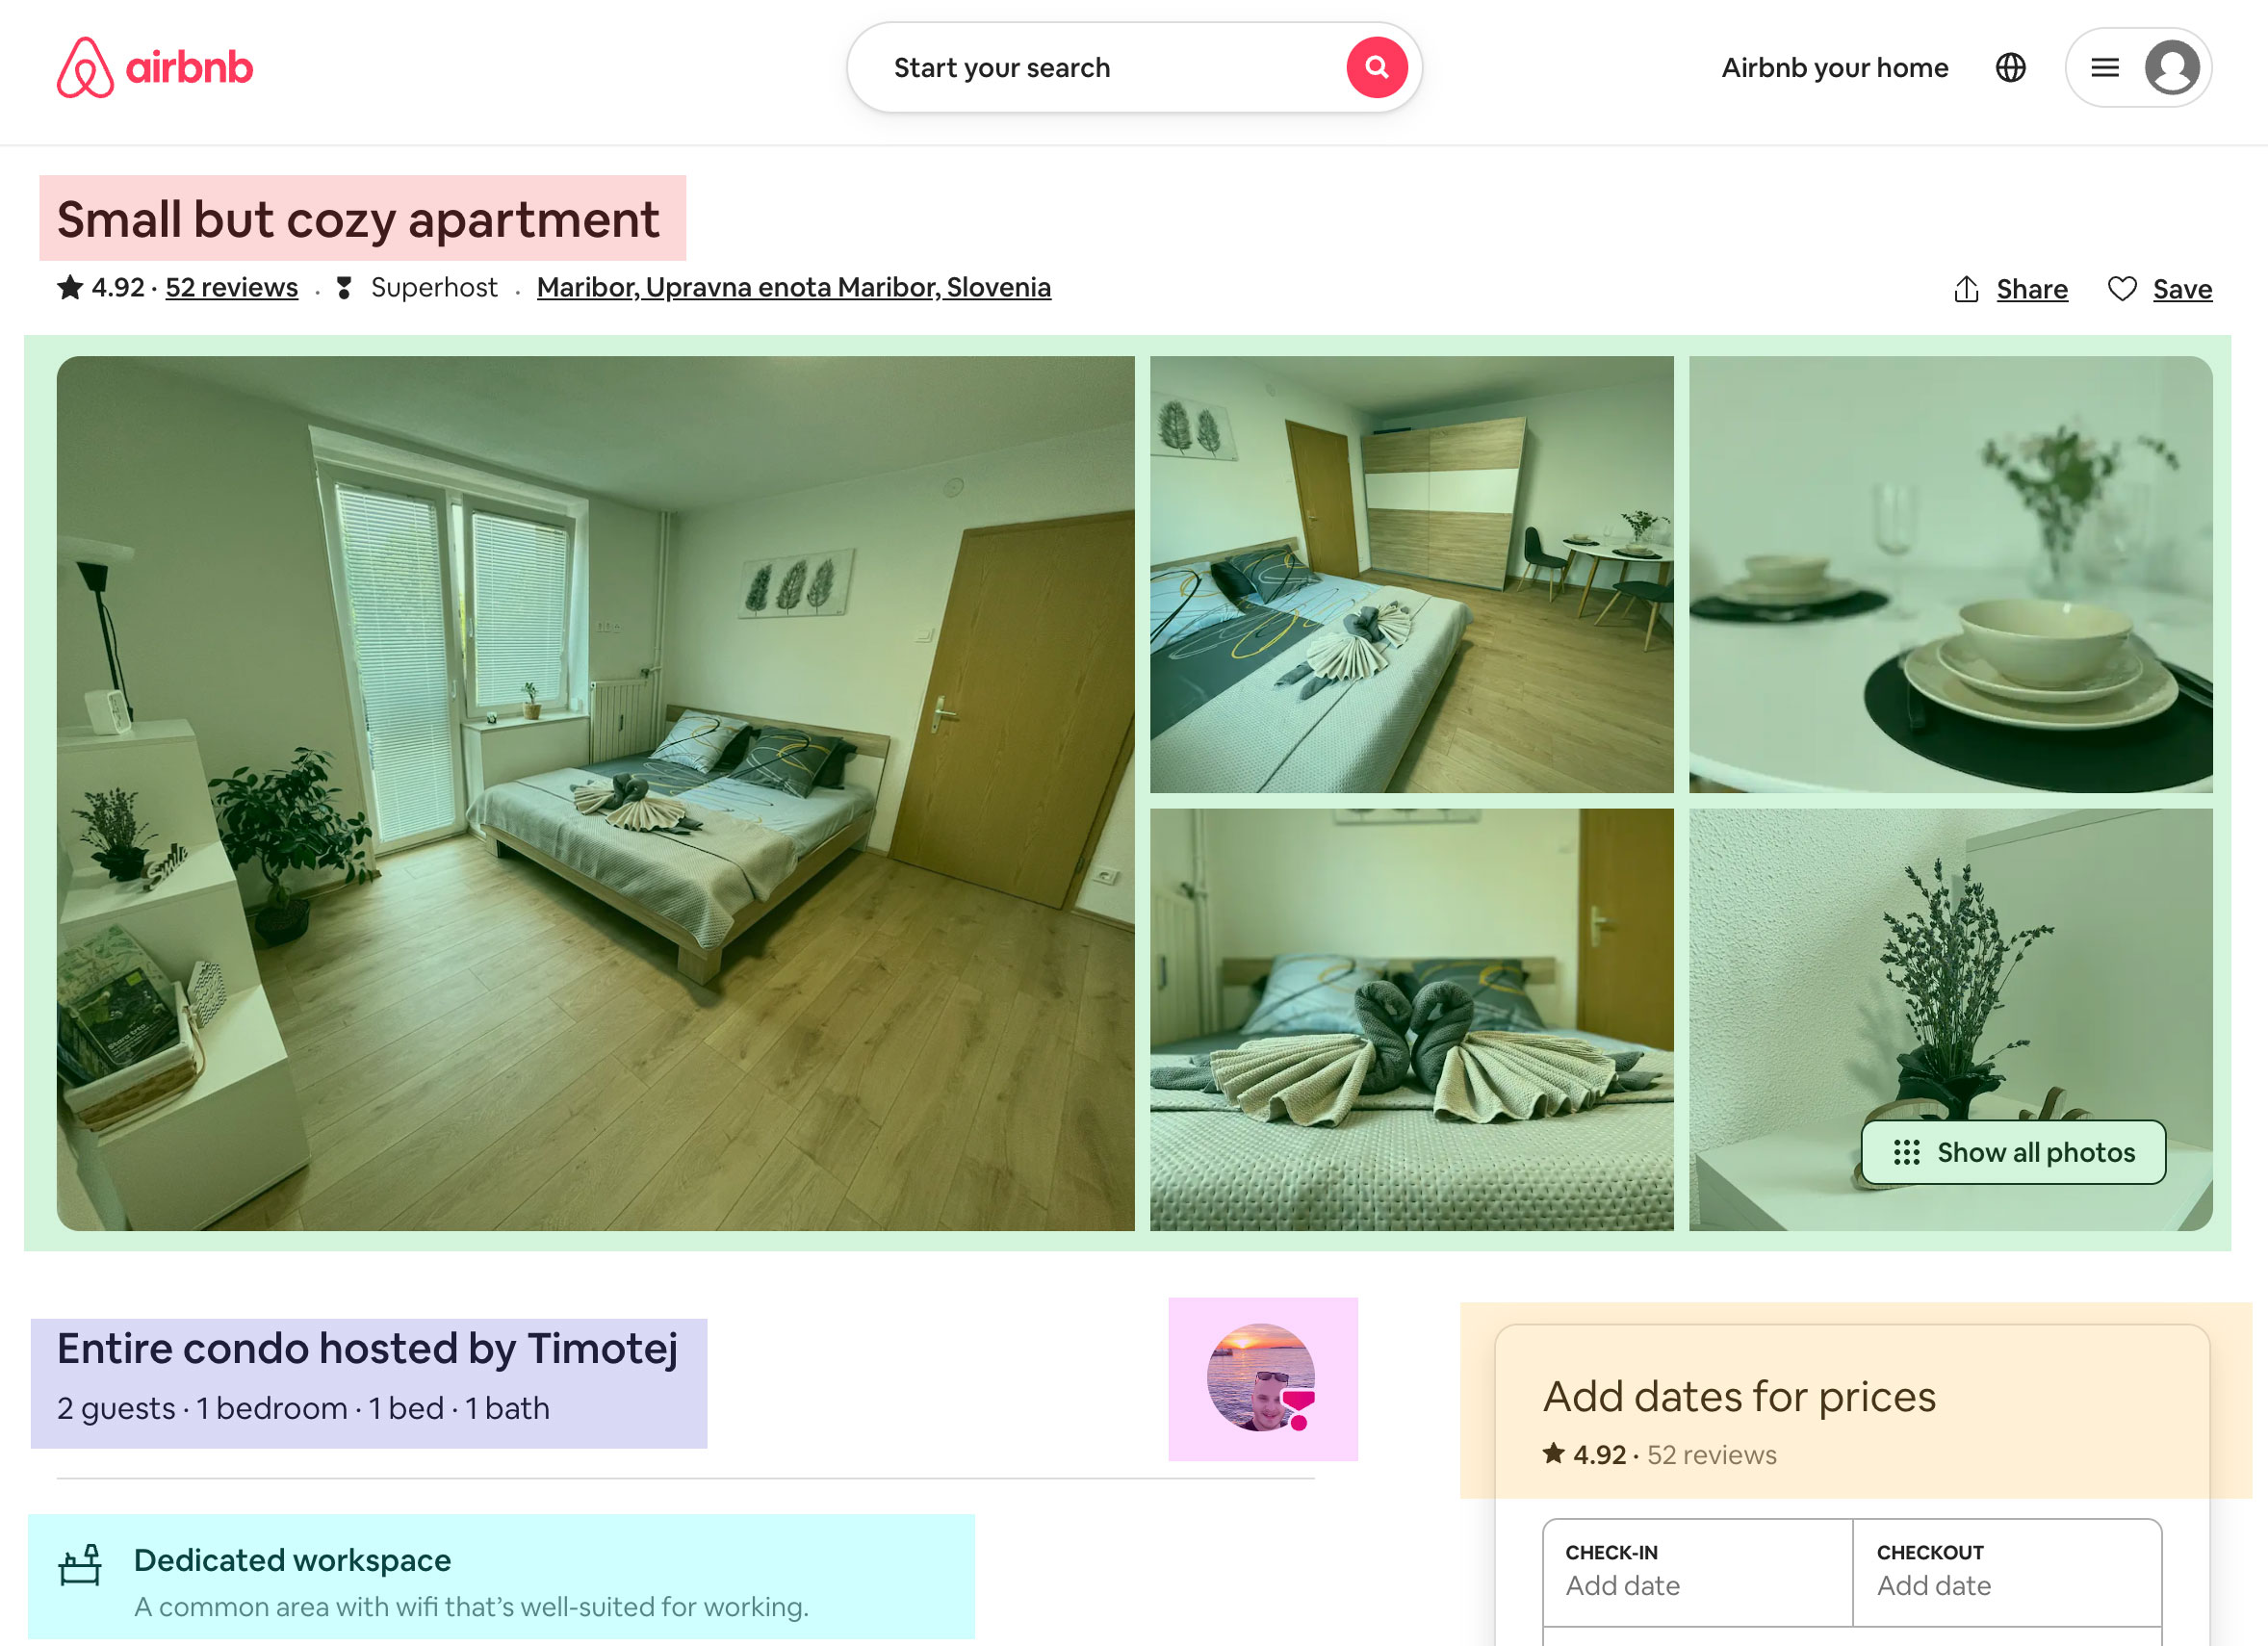
Property images
Compare different photos, angles, or lighting to showcase your property in the most appealing way. High-quality, visually striking images can significantly impact a potential guest’s perception of your listing.
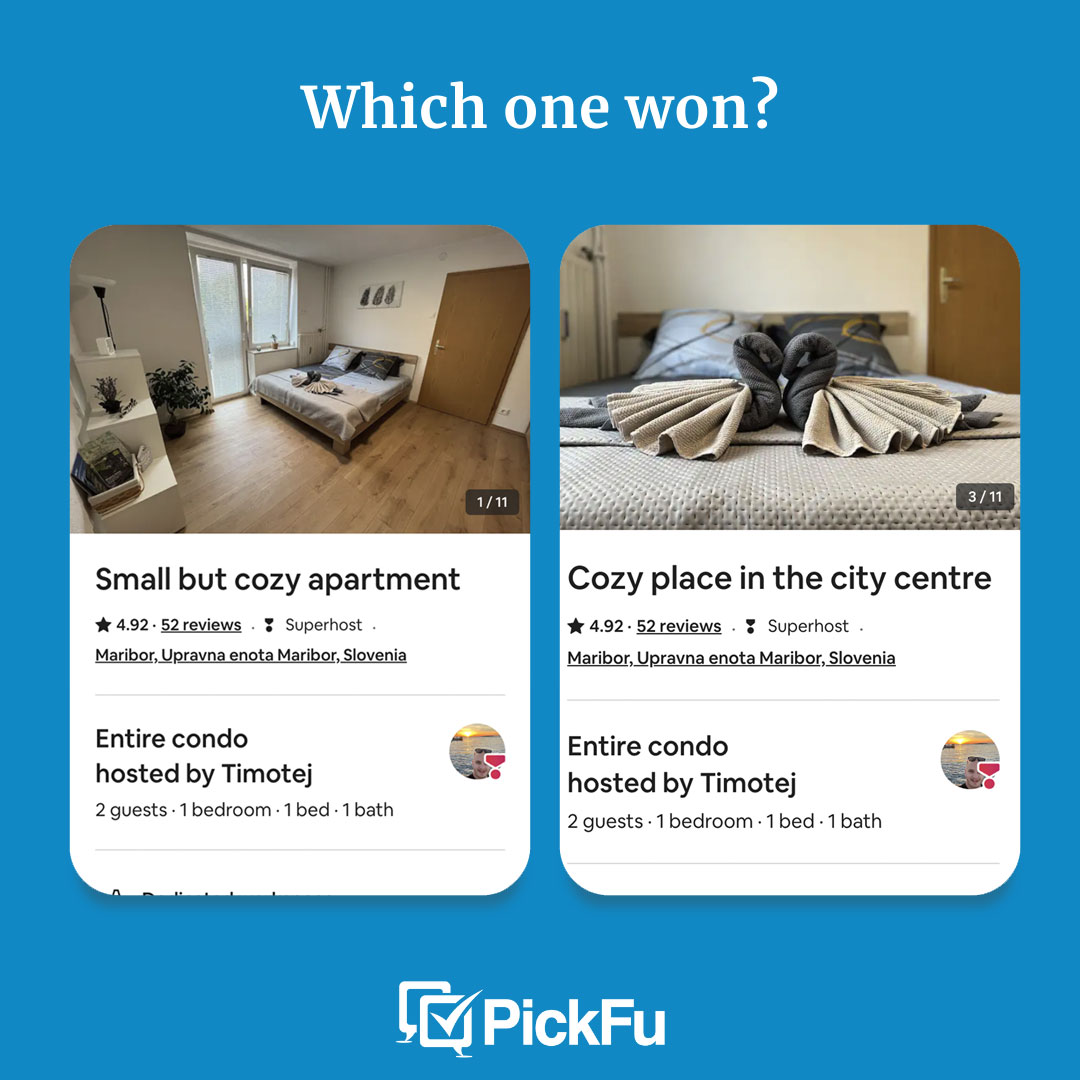
Thumbnail image
Experiment with various thumbnail images to determine which one captures attention and encourages clicks. A compelling thumbnail can greatly impact your listing’s visibility and click-through rate.
Pricing strategy
Test different pricing models or promotional offers to find the optimal balance between attracting guests and maximizing your return on investment.
Amenities and additional features
Test the impact of highlighting specific amenities or property features that might make your listing more attractive to your target audience.
By testing these key elements of your Airbnb listing using PickFu, you can gather valuable insights and make data-driven decisions to optimize your listing for better visibility, higher booking rates, and improved guest satisfaction.
Use PickFu polls to optimize your Airbnb listing
PickFu connects Airbnb hosts with real people who will answer your A/B test questions and choose the listing elements they find the most compelling.
A typical PickFu poll with 50 respondents will set you back around $45-$60, depending on your audience targeting settings and poll type.
But let’s take a look at how that investment can pay for itself, and then some, with this example:
- Nightly rate: $100
- Listing views per month: 200
- Conversion rate: 1.5%
- Average stay: 4.5 nights per booking
First, let’s calculate the number of bookings per month:
Bookings per month = Listing views per month × Conversion rate
Bookings per month = 200 × 0.015 = 3 bookings
Next, calculate the total nights booked per month:
Total nights booked per month = Bookings per month × Average stay
Total nights booked per month = 3 bookings × 4.5 nights = 13.5 nights
Assuming a 30-day month, the occupancy rate is calculated as follows:
Occupancy rate = (Nights booked per month / Nights available per month) × 100
Occupancy rate = (13.5 nights / 30 nights) × 100 = 45%
So, with a conversion rate of 1.5%, your occupancy rate is 45%.
Let’s assume that you have to run five PickFu polls to improve the conversion rate by 0.2 percentage points, from 1.5% to 1.7%. In that case, you’d spend $250 on polling.
With a 1.5% conversion rate, your monthly revenue would be $1,350, and with a 1.7% conversion rate, your monthly revenue is $1,530.
Your revenue would increase by $180 per month, which means you would break within just six weeks of using the optimized listing. A small investment in customer research can mean a big difference in your revenue over time. A/B testing with PickFu really is a no-brainer.
Ready to get started? It’s simple to create your first poll in PickFu. Sign up today to start your A/B testing journey to Airbnb success.