Editor’s note: Thanks to Danny Carlson for this guest post on Amazon A/B testing.
Amazon gets more competitive every year, which means Amazon sellers need a big edge over the competition.
One of the most tried-and-true ways to know if your product is better than someone else’s is to do a few rounds of A/B testing, also known as split testing.
But unlike your own e-commerce website, Amazon’s platform doesn’t allow you to install split testing plugins or tools. And messing with a listing too much can make the Amazon algorithm go haywire, putting your existing ranking at risk.
The good news is there is a way to split test your Amazon products, ads, and listings. It’s called Amazon A/B testing, and it’s a game-changer.
What is Amazon A/B testing?
The goal of an A/B test is to improve two things:
- Click-through rate (CTR): The percentage of shoppers who click on your product after finding it in search results
- Conversion rate: The percentage of shoppers who buy your product after viewing the listing
Improved click-through rates will boost traffic to your page, while improved conversion rates will boost your bottom line and make more efficient use of your traffic.
This has an added benefit: on Amazon, every sale you get is one less sale for a competitor, boosting your keyword ranking instead of theirs. Listings with a high conversion rate win a better position on Amazon’s search results.
Watch our video guide to A/B testing on Amazon below:
How to split test on Amazon
You have two options for A/B testing your Amazon listings:
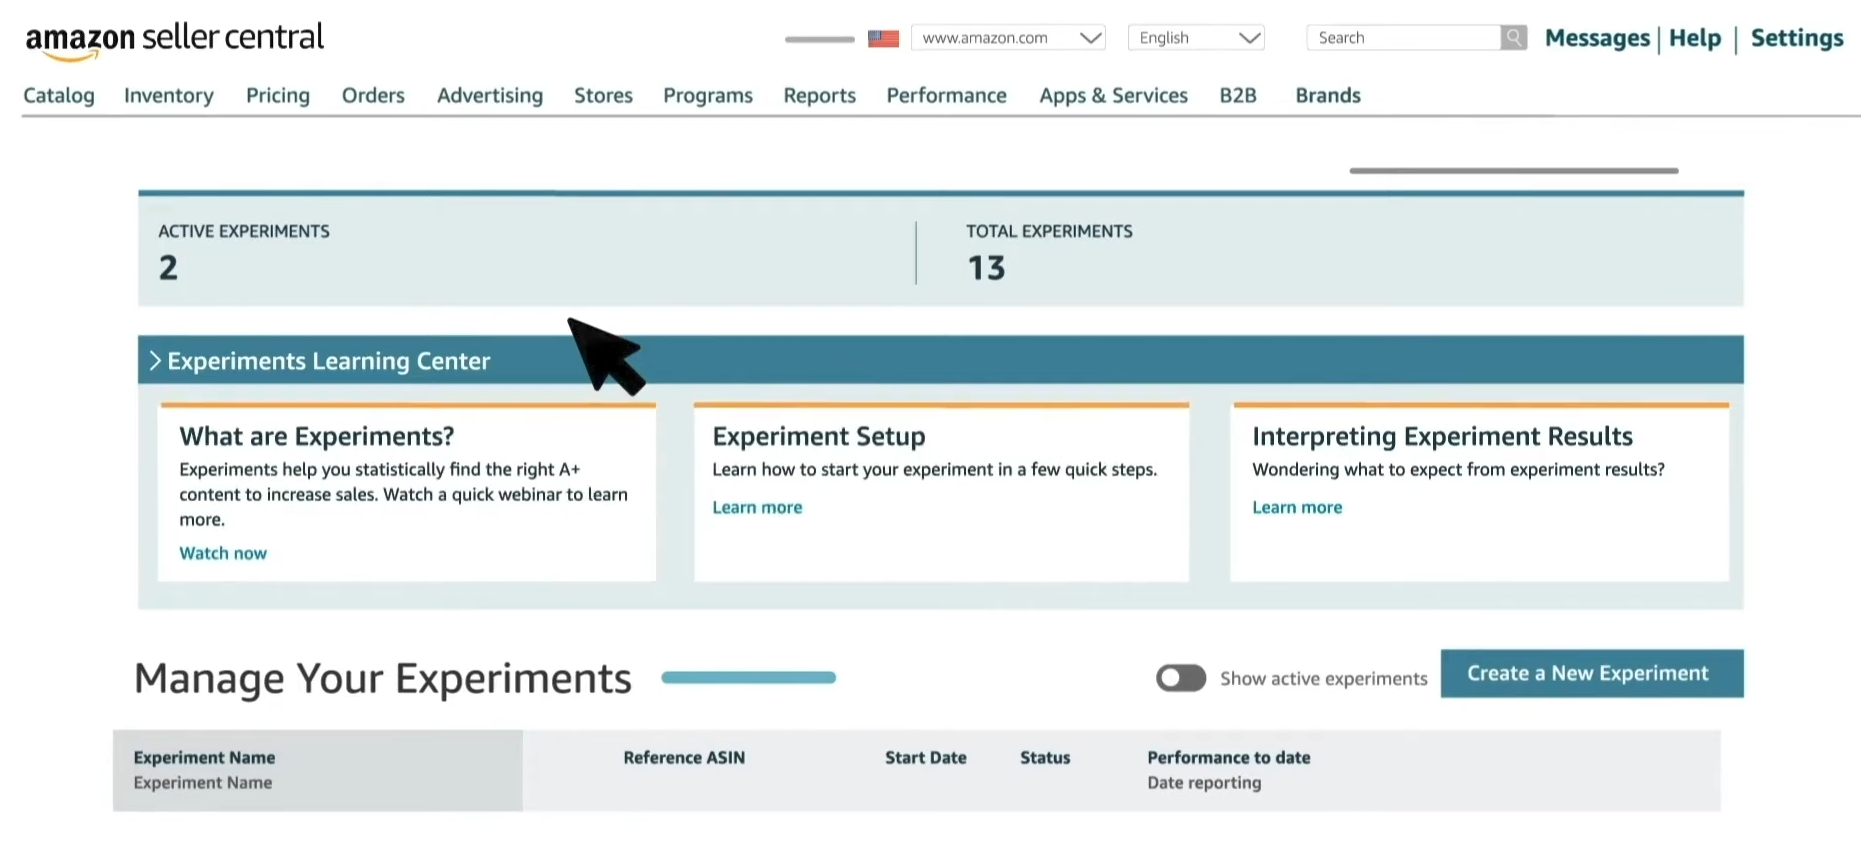
- Manually rotate your product listing variations in a live test (Amazon does offer an internal tool called Manage Your Experiments for split testing A+ Content, but it’s only available to certain sellers).
- Run surveys outside of Amazon to A/B test your product listing variations.
Let’s discuss the pros and cons of each.
Live Amazon split tests
The upside of testing live on your Amazon listing is that the data comes from real shoppers making real purchases. At the end of the day, live tests are the only way to get live data.
However, to get trustworthy data, you have to alternate your A and B versions every day for at least two weeks.
Why two weeks? Because unless you run your Amazon A/B test for a long time, your split test won’t account for daily fluctuations in sales or events outside of your control.
The big downside here is that if you frequently change your listing’s text and images, you risk doing three potentially damaging things:
- Confusing shoppers who come back to look for your product again
- Missing out on conversions and sales by showing a losing option half the time
- Messing with your keyword indexing
This is why we don’t recommend live split tests for any non-image parts of your product listing – especially the title or any fields containing your main keywords. Otherwise, you might stop indexing for that keyword. Yikes!
Off-Amazon surveys

The secret to successful Amazon A/B testing is to split test everything on a completely separate platform. You can do this before you even publish your listing, which is a huge asset.
If you publish a listing that your survey respondents love, you can confidently assume that your customers will bite.
Plus, you won’t mess with your Amazon listing. You can run multiple split tests simultaneously to get your data more quickly. Then, you can use that data to change your live listing.
With a service like PickFu, you can target which demographic groups respond to your survey. That way, your respondent pool is as close as possible to your actual customers. Of course, they won’t really be your customers – and that’s a downside of split testing off the Amazon platform.
But you get results so much quicker with a third-party Amazon split testing service that it’s worth it. Especially if the respondents give you written feedback, like they do when you use PickFu.
Here’s a quick list of the Amazon A/B testing tools out there:
- CashCowPro
- FigPii
- PickFu (yours truly!)
- Manage Your Experiments
Real examples of Amazon A/B testing with PickFu
When it comes to Amazon, what you like best doesn’t matter as much as what your target audience likes best. That’s why split-testing is so important.
Let’s take a look at three recent PickFu polls run by Amazon sellers.
To include the packaging or not… that is the question
In the first PickFu poll, a seller asks respondents to choose which image they’d click on if they were shopping on Amazon. The seller posed this question to a group of women with children five years old and under:
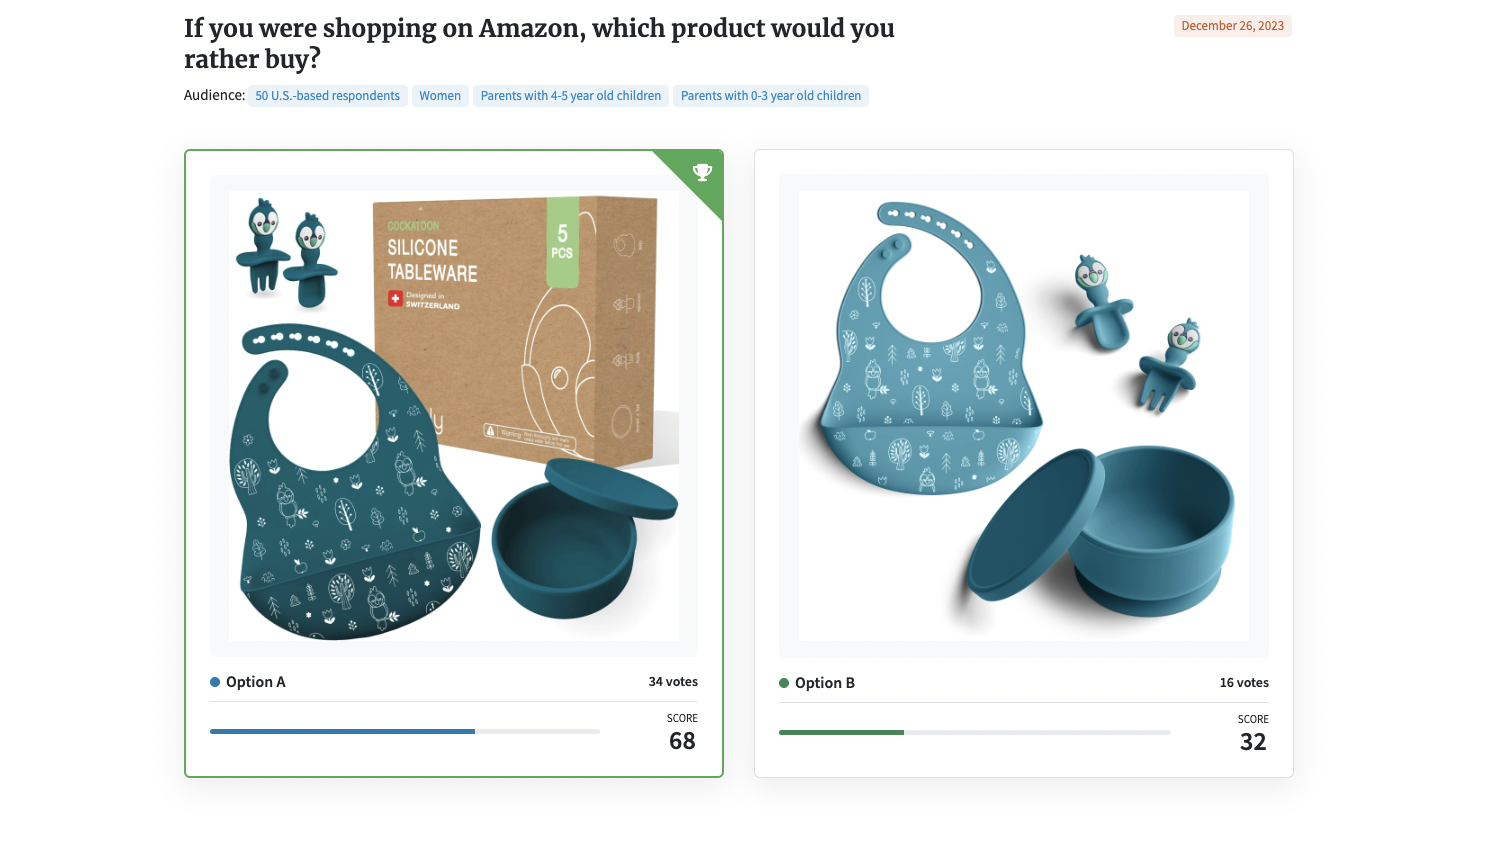
The two images are nearly the same. They show the same products – albeit in slightly different colors. The only real difference is that one image shows the packaging.
But that’s enough to make it a winner. Here’s what these parents said:
- “[Option A] gives a sense of ‘going together as a group,’ while Option B seems like a bunch of stuff randomly being there.”
- “[Option] A includes the packaging, making it more informative.”
- “I chose Option A over [Option] B because it contains an image of the box, which tells me exactly what the product is, what it is made of, where it was manufactured, and how to care for/clean it, which is all very important information to know up front. I also like the deeper color of [Option] A.”
With this quick split-test, the Amazon seller now knows to include the packaging box in the image. They also know that many respondents prefer the darker color, because as one mother put it, “I prefer darker colors for babies and toddlers because they don’t stain as bad.”
Which set of unique date idea cards wins?
Let’s look at another example. This one is interesting because the seller ran two split-test polls back-to-back. In both, they asked respondents which set of date night idea cards they’d purchase on Amazon.
In the first poll, the main titles of the two idea card choices are:
- “Borganic Dates” – Option A
- “52 Scratch Off Date Ideas” – Option B
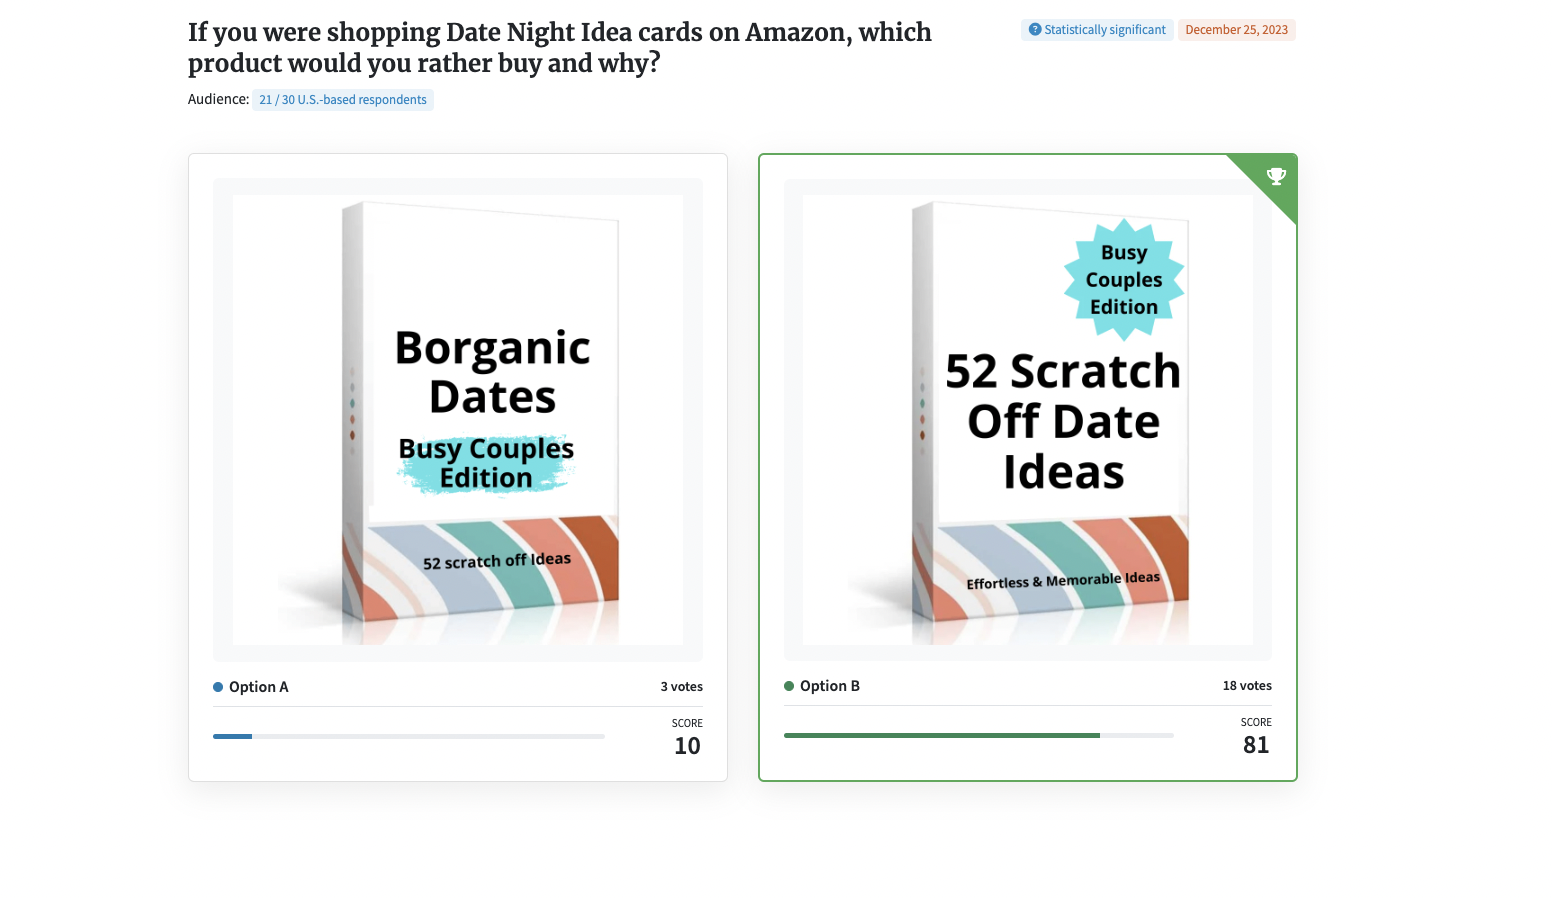
The PickFu respondents weren’t quite sure what “Borganic” meant. It’s the kind of idea that can sound great in your head but not make sense to anyone else.
The respondents said things like, “I know what ‘organic’ means, but I have NO IDEA what ‘borganic’ is.” And, “I’m not sure what ‘Borganic’ is or if it is just a typo so I have to go with Option B.”
Needless to say, Option B won by a long shot.
But was it just because people weren’t sure what the seller meant by “borganic”?
The seller ran another poll, presumably to find out. This time, the two main titles were:
- “52 Scratch Off Date Ideas” – Option A (but the same choice as Option B in the first poll)
- “Not So Boring Dates” – Option B
This time, both titles make perfect sense. But the “52 Scratch Off Date Ideas” set still takes the cake.
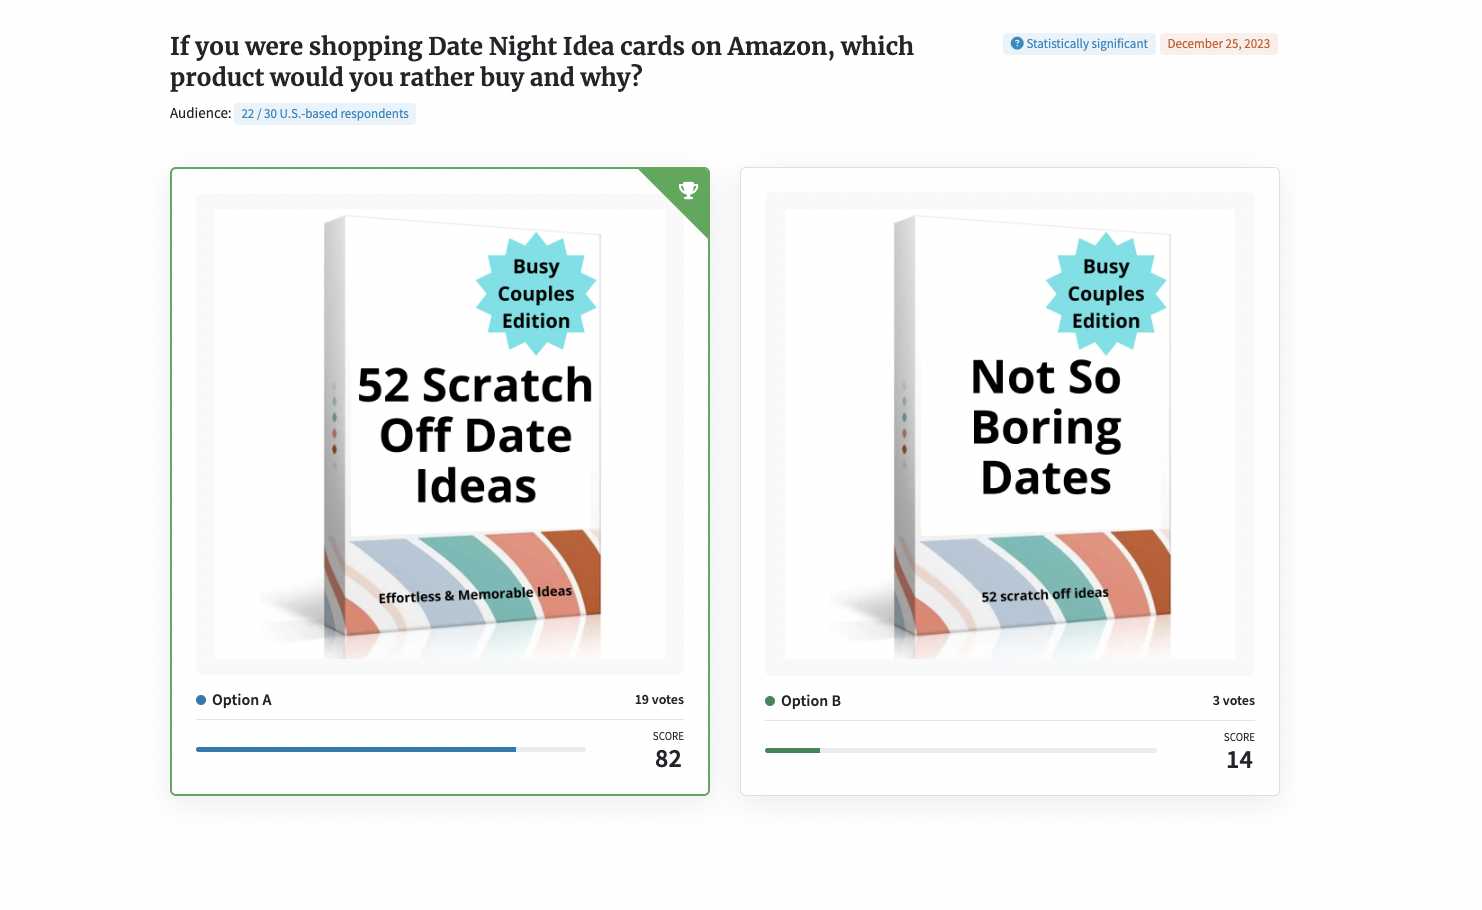
Let’s see why, in the respondents’ own words:
- “The ‘scratch off’ part [in Option A] adds a little bit of excitement and makes it so each card will be like a surprise.”
- “[Option] A sounds a lot more fun and intriguing, I don’t like the other name because it implies the dates would be somewhat boring.”
- “I like [Option] A because it has an element of surprise.”
Now the seller has a set of date night idea cards that has won two polls.
These are the types of Amazon A/B testing results that save you from failing on the e-commerce platform. (And it looks like that’s the title the seller went with!)
Imagine if they’d gone with Borganic Dates?
Amazon A/B tests with the highest impact
What are the first things every Amazon seller should test?
Certain parts of your listing get much more attention than others.
Here’s where we recommend putting your focus when it comes to Amazon split-testing.
Main image split tests
The single most important element to A/B test is your main image.
It’s the biggest factor that affects click-through rates from:
- Search results pages
- Amazon Ads
- Social media posts/shares
- Your competitor’s listings (in sections like Frequently Bought Together, Compare With Similar Items, and Customers Frequently Viewed)
If your main image sucks, it almost doesn’t matter how good the rest of your listing is because no one will see it.
So how do we optimize the main image?
We like this comprehensive step-by-step guide here, but we’ll cover the key points below:
- Variations: Make at least four variations that are as different as possible from each other, then, based on the winners, create more variations similar to those.
- Space: Have the product take up the maximum amount of space possible.
- Angle: Position your product at 15 degrees. A 15-degree angle almost always performs better than a direct top-down view because it shows the product in three dimensions instead of two.
- Graphics: Add a graphic reflection effect to make the product stand out.
- Background: Have the background digitally removed so that it looks seamless.
- Components: If your product has several pieces, shoot photos of each component separately, then place them together later in Photoshop. This enables you to more precisely and easily create layout variations. Just be sure to shoot each piece at the same angle or else they will look weird when placed together.
(Note: Curious on how PickFu can help with amazon main image optimization? Check out our related article!)
The title’s first 75 characters
After your main image, the next most important field to A/B test is your product’s title. Shoppers won’t click if they can’t quickly and easily know your product is the one they’re looking for.
Use your main search phrase in exact match at the beginning of your product title.
This method helps for keyword ranking purposes, but it also clearly states what your product is. To find your main search phrase, look for a keyword that’s both high in search volume and can stand alone to explain your product.
After your main search phrase, include the most important descriptors about your product. What key details does your target customer need to see in order to know your product is the one they’re looking for?
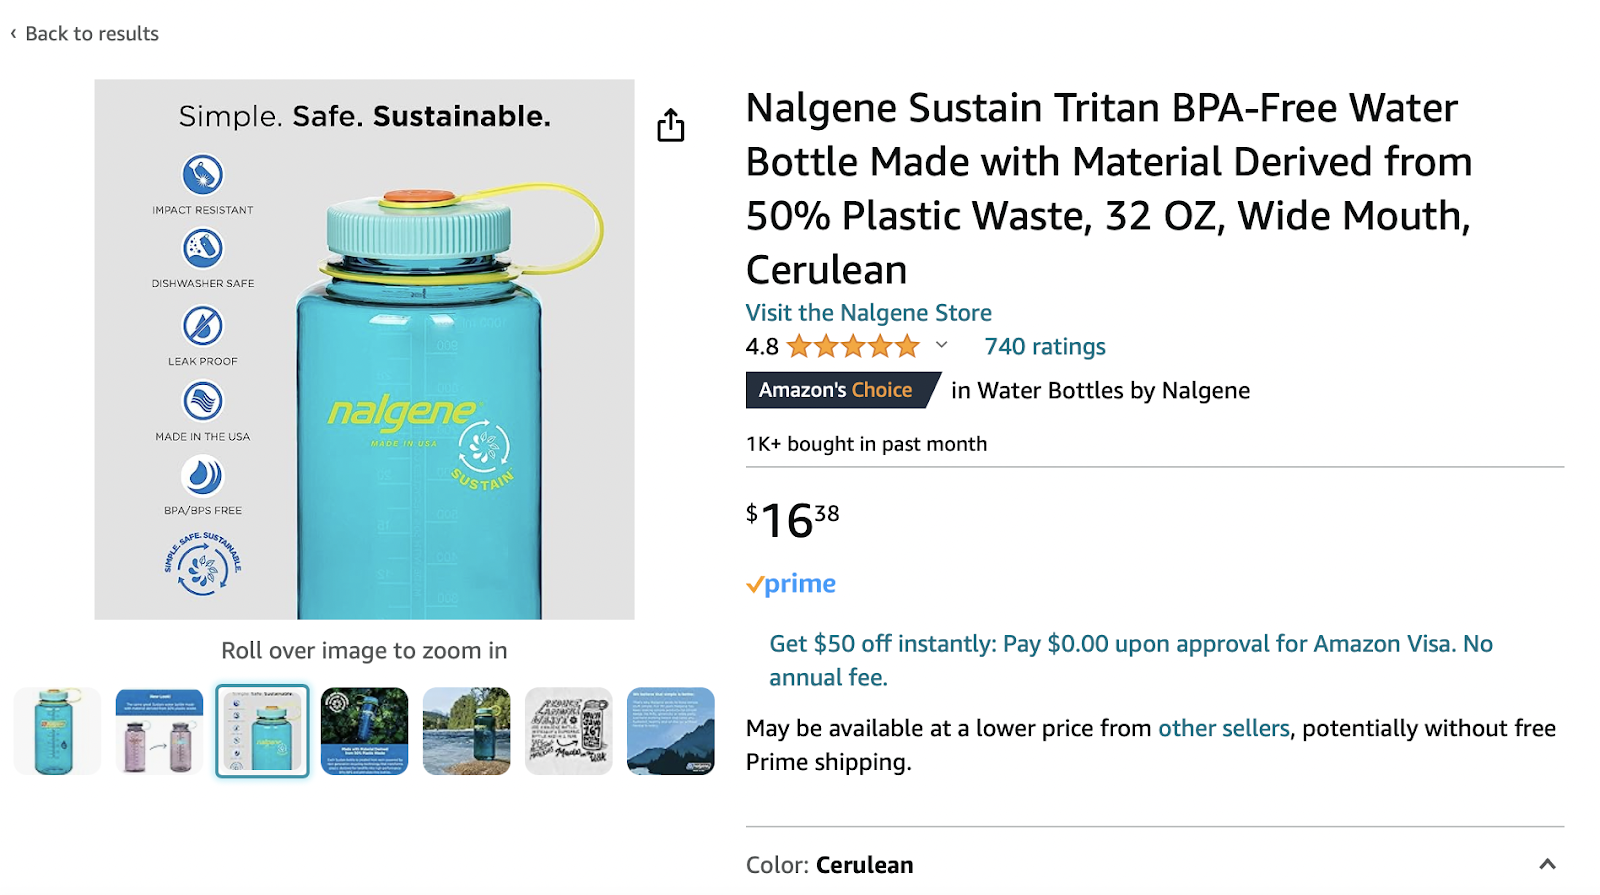
For some products, these important descriptors may be “BPA Free,” “Pack of 25,” or “Bluetooth 4 Compatible.” It varies depending on your product.
To identify what’s essential about your product, PickFu polls will offer useful insights.
Try split testing four or five product title variants with survey respondents in your target market.
This way, you don’t change your Amazon listing and risk ruining the keyword indexing until you know it’s worth doing so.
Live Amazon A/B testing with PickFu data
Once you’ve done a few tests and gotten some good data from PickFu, it’s time to implement changes on your Amazon listing to see how it performs. Upload the poll’s winning image or text to your listing and make note of the date and current metrics in a spreadsheet so you know what your baseline is.
Check back the next day just to make sure nothing went totally haywire. But as long as your keyword indexing is fine and conversion rate didn’t tank, leave it to gather data.
A week later, check your business reports and find your Unit Session Percentage. Did it go up? Down? Stay the same? How does it compare to your PickFu survey results?
Note: Refer to Unit Session Percentage instead of what Amazon calls the conversion rate. Unit Session Percentage varies slightly from your conversion rate because Amazon directly calculates the percentage of units sold to listing impressions. This means that orders with multiple units will skew the percentage to look higher than your true conversion rate, but generally not enough to worry about.
You’ll also want to check your click-through rates by downloading a Search Term Report from Amazon Ads.
Download a Search Term Report for the week leading up to your change, then one for the week following. Run a basic calculation to calculate the average click-through rates from each period.
To get good data here, you need to have run ads for a while with at least $3,000-$5,000 per month in ad spend to see any marked difference.
If you meet these ad criteria, ask yourself the same questions about the click-through rate: Did it go up? Down? Stay the same? How does it compare to your PickFu survey results?
Don’t skip the split-tests
Not many strategies make an impact like split-testing does.
Think of Amazon A/B testing’s ROI like compound interest. At first, the small improvements don’t add up to much, but over time improvements stack on each other and the difference grows exponentially bigger.
Check out our Amazon poll templates to get started with A/B testing quickly and easily.
Danny Carlson is a 27-year-old entrepreneur, podcaster, and lifestyle architect. In 2014, he started his first business producing extreme downhill longboarding videos. He has since grown the Amazon FBA Agency Kenji ROI to more than 10 team members. Kenji ROI has served over 500 Amazon sellers by creating photos, video, copywriting, and graphics for over 1,240 listings.
Danny is also the host of the Actualize Freedom Podcast and the Danny Carlson Podcast. He has completed more than 60 interviews with names like Daniel DiPiazza, Steve Sims, Manny Coats, and Kevin King.
Residing in Bali, his off time is spent doing standing acrobatics, ripping sport motorcycles, and training at Nirvana Strength.