
Unmet needs are complicated in any relationship, but they’re especially bad when it comes between you and your customers.
Identifying your customers’ needs doesn’t have to feel like black magic.
It doesn’t have to cost you as much as rocket science, either.
Today, we’ll look at the big gaping hole between businesses and customers, what you need to do to identify your customers’ needs, and most importantly, how to actually turn your results into insights.
Here’s a quick list of links if you want to jump around this article. In a rush? Be sure to check out our TL;DR summary. 👇
- Research insight: To meet customer needs, start with addressing their product needs
- #1. Send existing customers surveys (+ free mockup)
- #2. Conduct audience research with a third-party audience pool
- #2a. How to run a customer need discovery poll with PickFu (+ starter question)
- #2b. How to analyze your customer research from an open-ended poll
- #3. Use social listening programs and Google Trends for supplementary data
- Infographic: Discovering and understanding customer needs in 3 steps
- TL;DR: Identify customer needs in three straightforward, real-world steps
Research insight: To meet customer needs, start with addressing their product needs
Let’s get started with the big question first: Do businesses actually care about customers’ needs?
According to customers, no, not really. At least not out of any goodness of their hearts.
When I polled 100 American consumers about whether they thought businesses had their needs at heart, the results were a dead split.
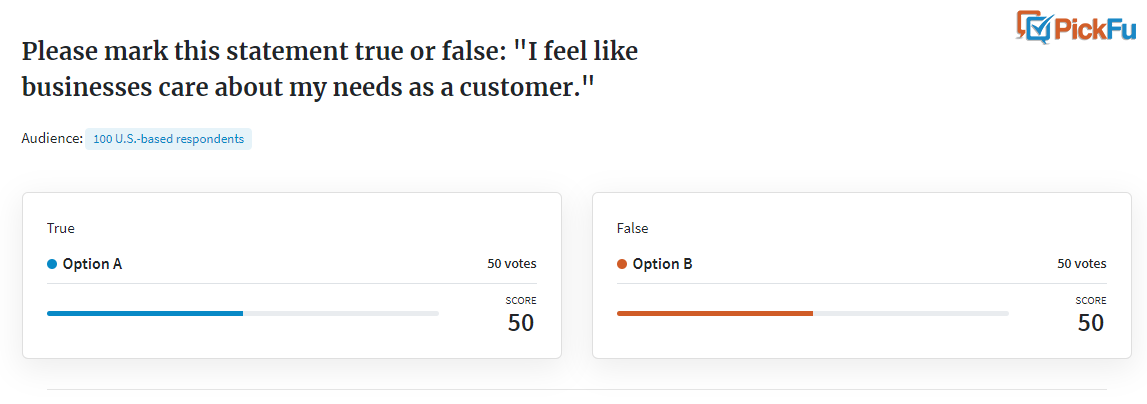
But like most things in life – and all things in business – there’s nuance. The picture gets grimmer when we look inside the comments.
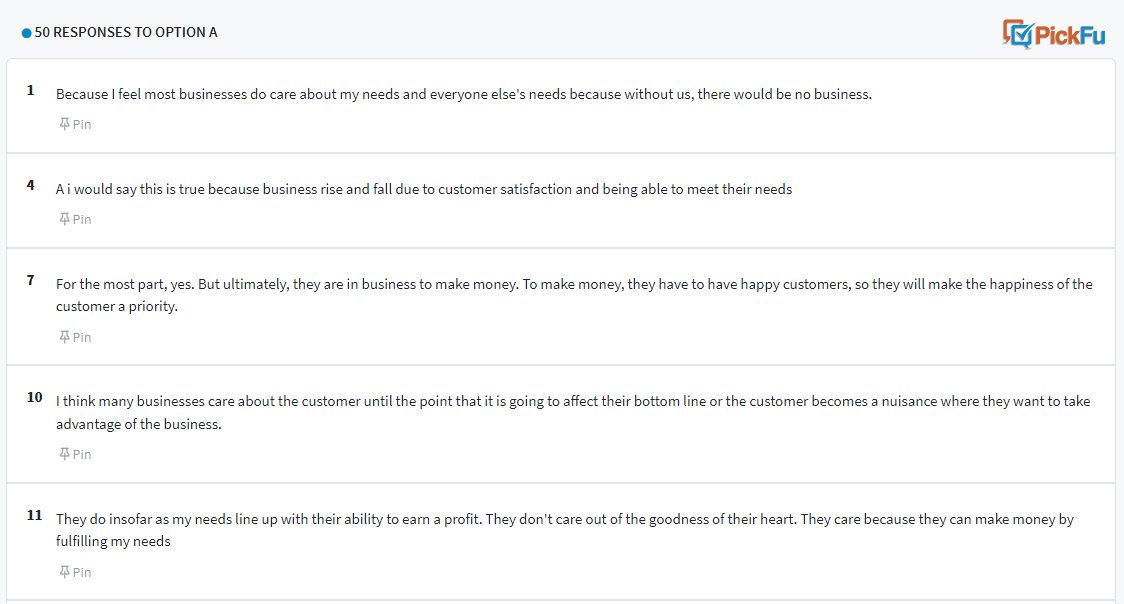
There’s good news here despite this, and it’s not all cynical. The good news is that customers do think businesses are responsive to their needs, but very few think it’s because you care about them personally.
It also turns out they’re okay with that, flying in the face of many marketing research reports about what users want from brands.
I ran another poll with 100 additional consumers to find out what turns them into loyal customers for a business. It turns out it’s not about your brand or service at all.
It’s about your products.
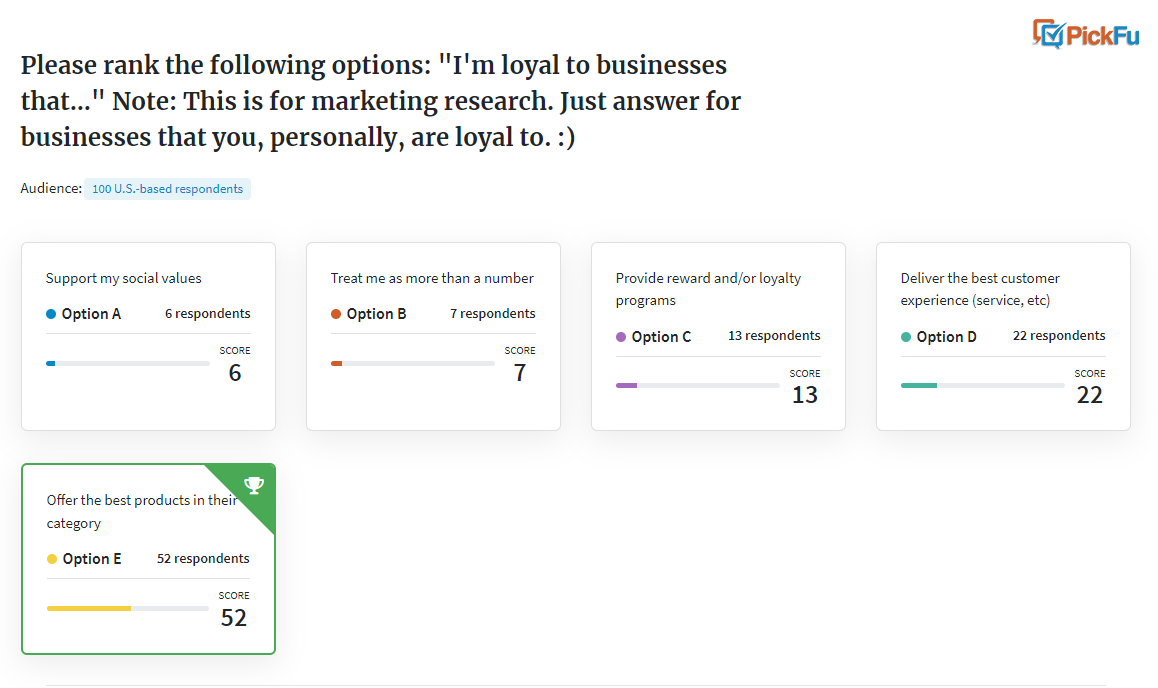
Overwhelmingly, businesses that create the best products in their given category earn the most customer loyalty. People are looking for value and product quality. They don’t care as much that businesses are out for a profit or if they have the best support teams anymore.
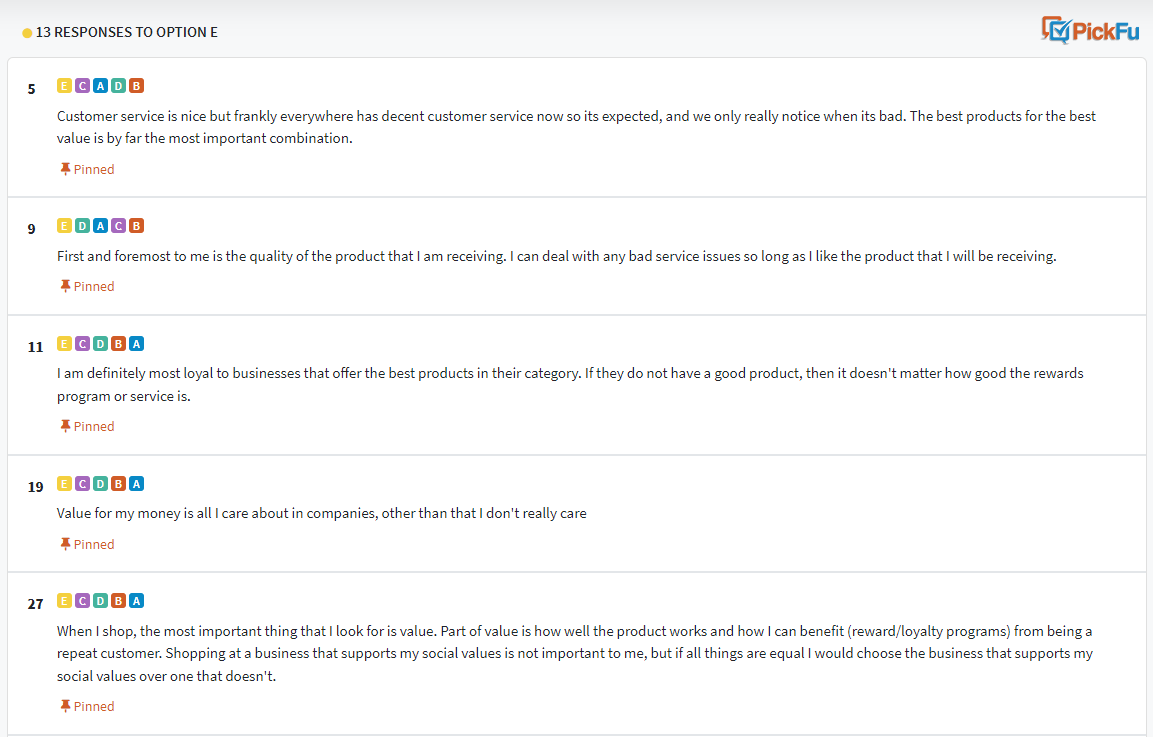
Interestingly, aligning with social values is all but a footnote to most consumers polled. Being treated as more than a number, something we should all strive for regardless, is only marginally more significant than that.
When asked to rank the most important consideration for choosing a new product or service, purchasing decisions came down to product features and price. Customers care about those two things in a landslide over design, customer service, and ease-of-use.
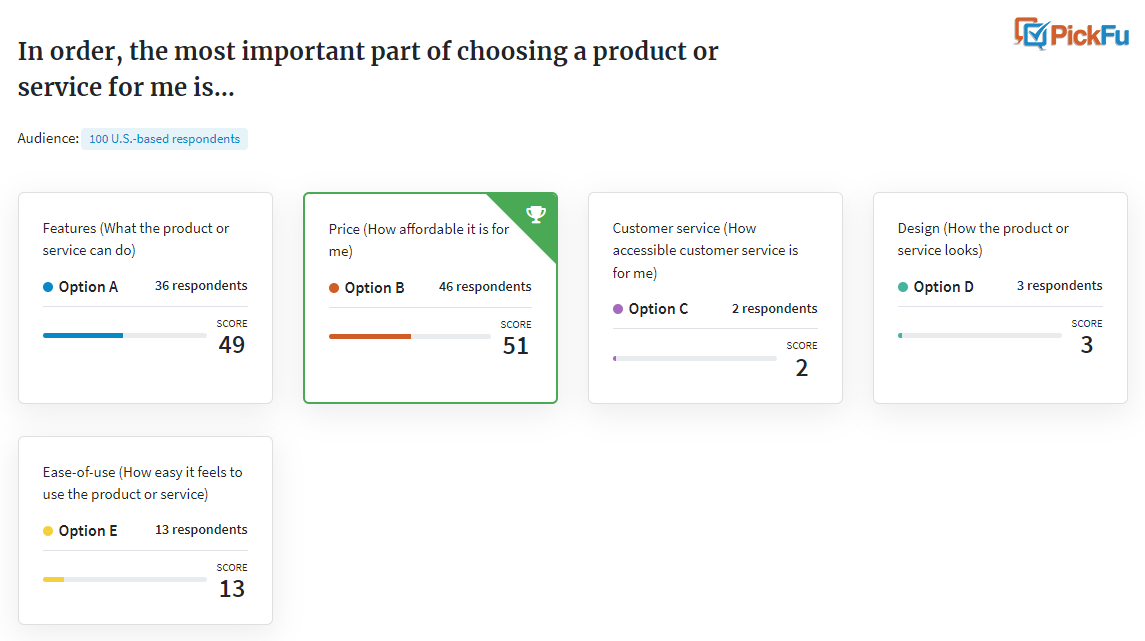
Does that mean you can devote all of your resources to just selling products and still meet customer expectations? No. Customer satisfaction requires all of these aspects we’ve mentioned. It’s a pecking order of priorities.
The biggest takeaway from these three polls isn’t that people want to be treated like robots, either. It’s that they demand you meet their needs with your products first. Any effort to satisfy their needs outside of a best-in-class product won’t have staying power.
Now, with that understanding out of the way, let’s look at how to actually identify the specific needs of your customers.
How to identify your customers’ needs
#1. Send existing customers surveys (+ free mockup)
If you already have a customer base and you’re trying to understand what they need, ask them.
Yes, it’s that simple.
There is no better source of customer insights than your customers themselves. You could spend weeks trying to gather secondary data and never come close to the value that a handful of customer interviews offers.
Customer surveys are a low-cost, low-effort way to start uncovering potential opportunities. They’re a standard arrow in the marketer’s quiver for gathering information and a marketing research technique anyone can and should use.
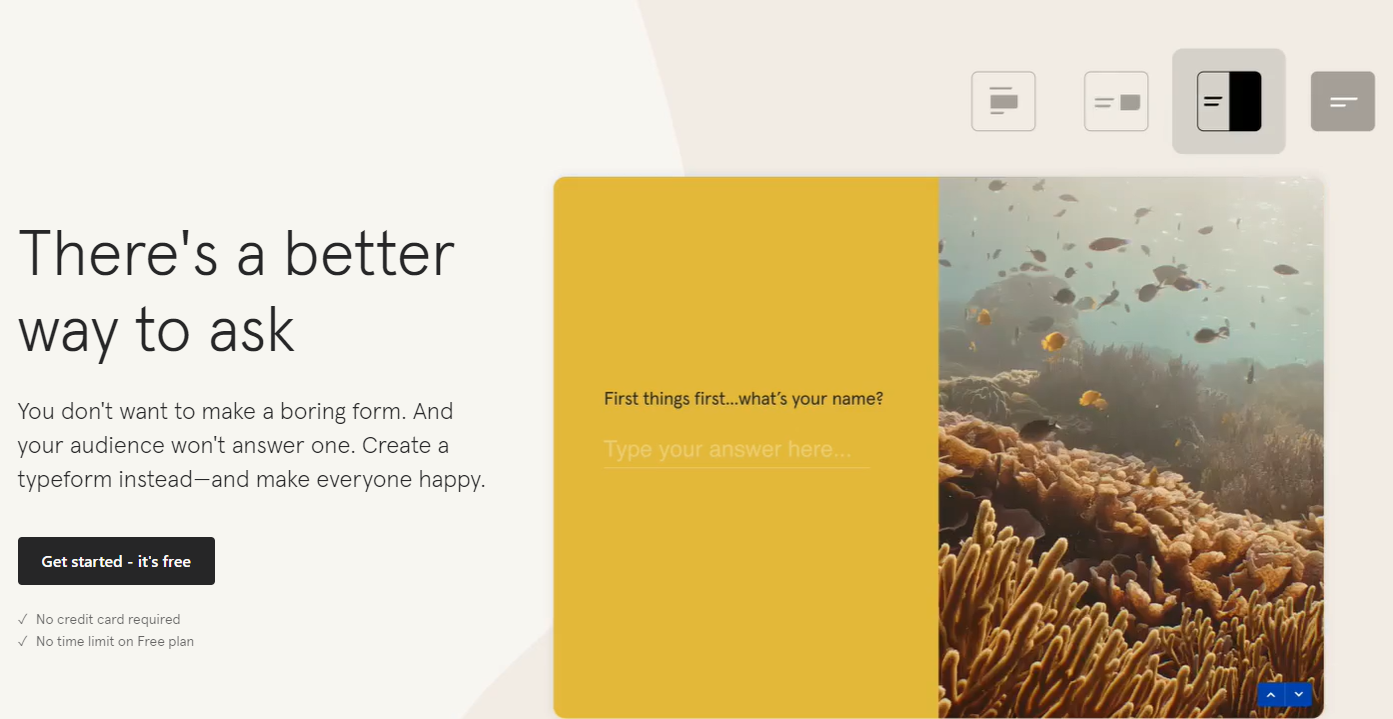
Personally, I’m a huge fan of Typeform for performing customer needs analyses.
It’s also good for gathering any form of primary customer data generally, which is data sourced directly from interactions with an audience. Primary data is, bar none, the gold standard for identifying current customer needs – even potential customers’ needs far on the horizon.
I created a free 5-question customer needs survey mockup for you to copy here.
You’ll notice that this survey doesn’t ask attitudinal brand questions or for customer feedback on the business specifically. Keep your questions focused on the objective of your search and the need you want to find.
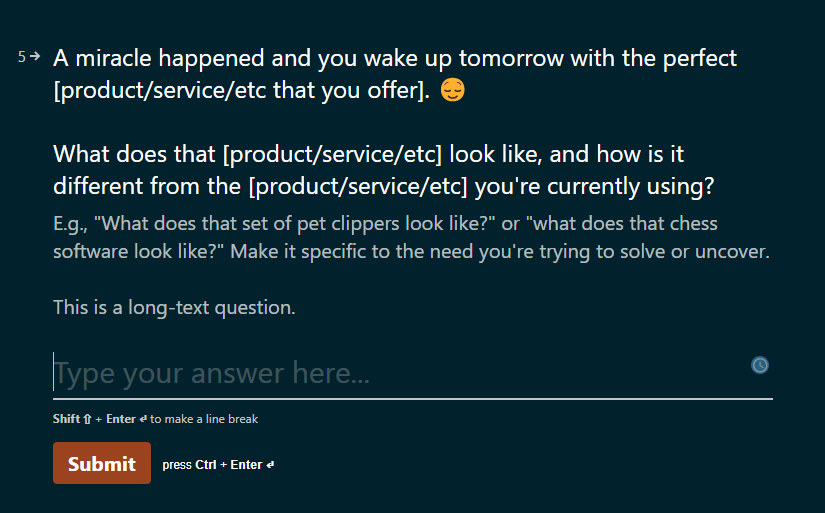
If you’re trying to identify customer needs for existing products, for instance, tailor your questions around those products, but keep it hypothetical. You want your respondents to answer with their wildest imagination for what that product could be. The fewer constraints, the better.
You should only use attitudinal questions for customer need discovery if you’re in the earliest stages of product development and need more inspiration than insight.
To create your own Typeform, start with signing up for a free account. Then, once you’re logged in, choose which workspace you want to work out of from the left-hand side.
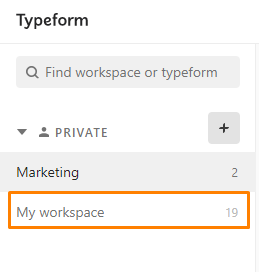
By default, this will only show one workspace, outlined in orange above.
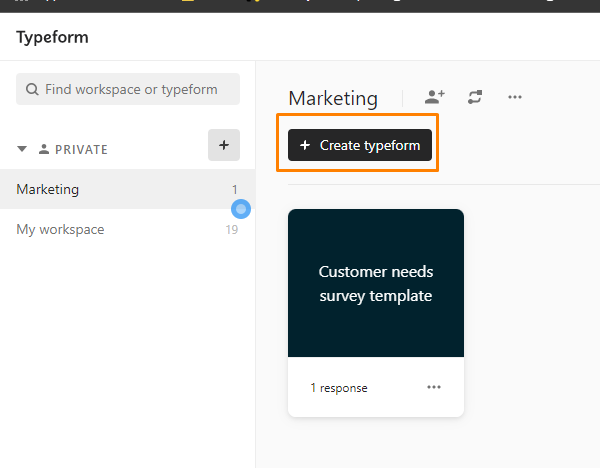
Once you’re at your workspace, click “+ Create typeform”.
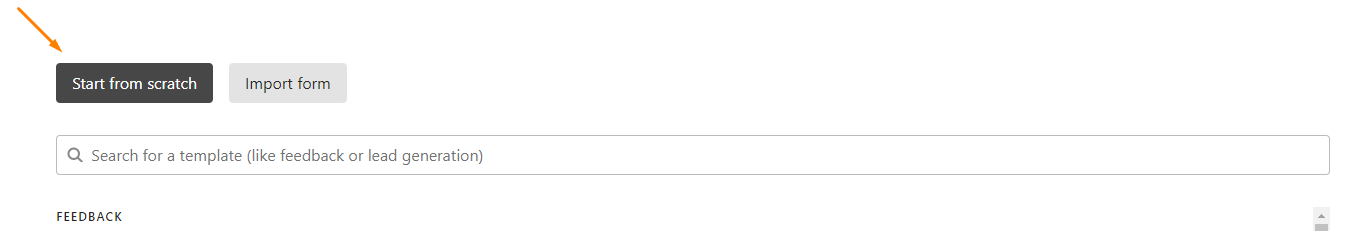
On the next screen, choose “Start from scratch”.
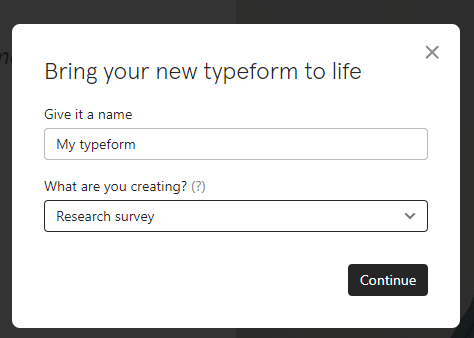
Give your survey a short-and-sweet name and choose the first option on the drop-down menu.
Go for clarity over cleverness with your title. “Customer needs survey” is perfectly acceptable. If you start overthinking it, just leave the default title and come back to it later.
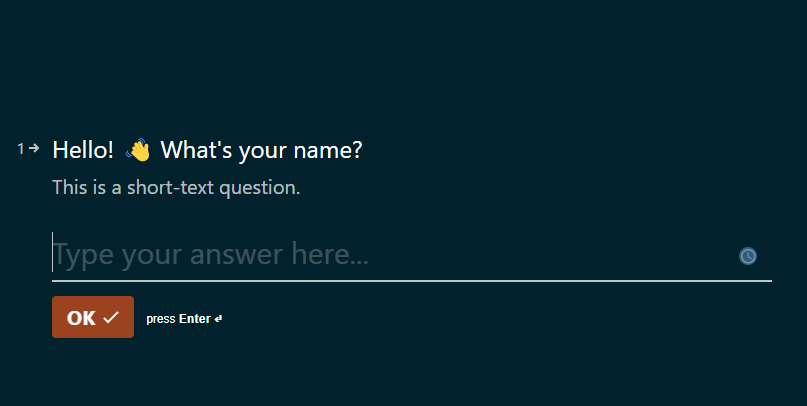
Now all you need to do to add new questions is select the “+” button in the right-hand menu. If you’re following our template, each question will say which type of question field to use to recreate it.
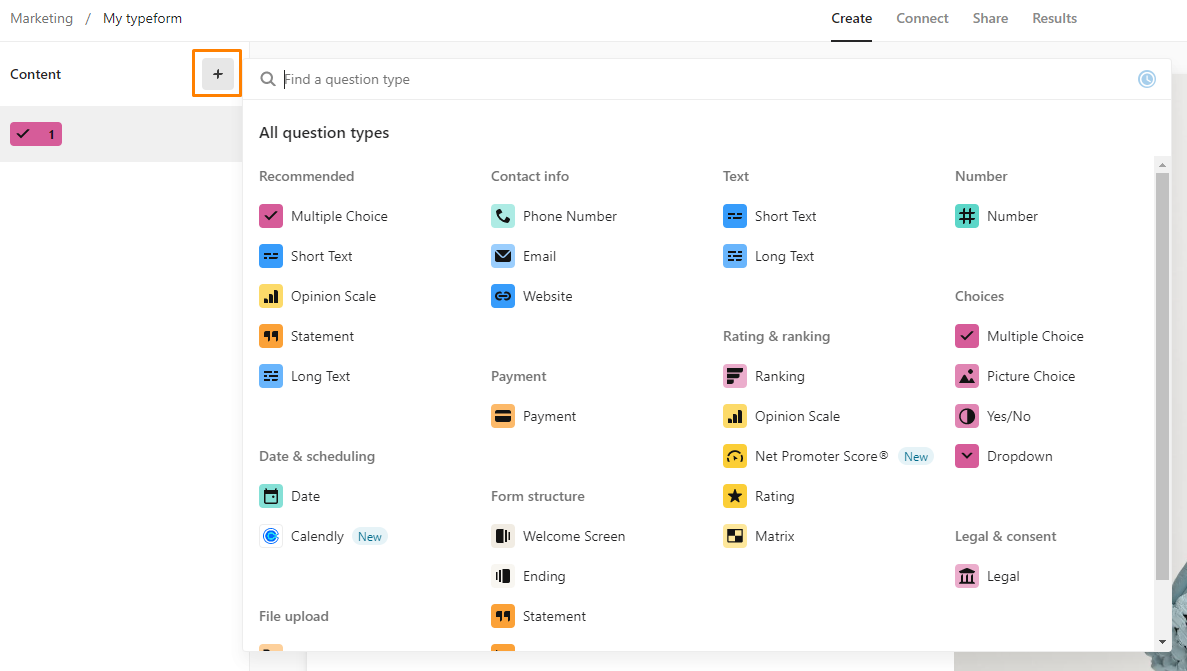
If you want to dig in deeper on questions than the mockup I created, Typeform also offers this comprehensive example list of survey questions you could use.
Some quick and dirty examples of question types are:
- Rating questions: On a scale of 1 star to 5 stars, how interested in this product feature are you?
- Closed questions: Are you a thermonuclear physicist? Do you live in Stark Tower?
- Open questions: What would your superpower be? How would you save the world?
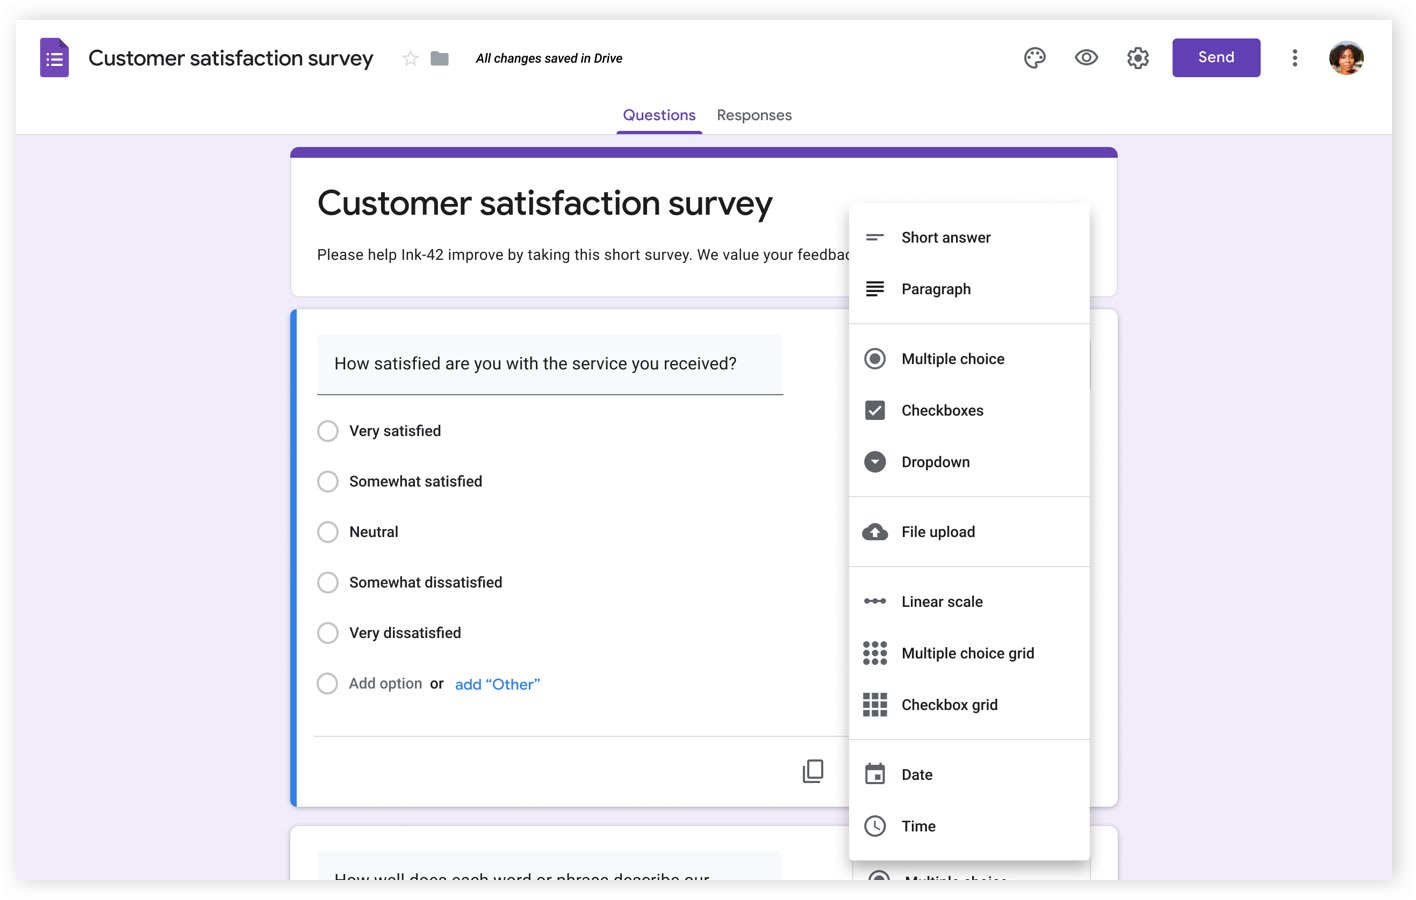
Alternatively to Typeform, Google Forms is also free and very respectable, though not quite as user-friendly.
Regardless of how you send your survey, your first stop should be your customers. Think of your email list especially as your own internal focus group – and expect to incentivize them accordingly.
Depending on format, surveys have an average response rate of 33% or less.
But response rate can plummet to as low as 2% if you don’t offer an incentive to finish the survey.
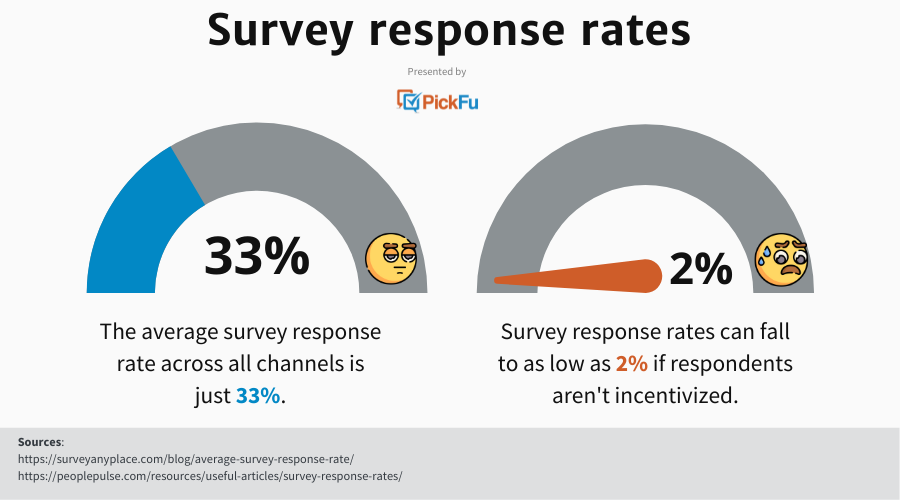
Scary, right? Customers may be your best source of intelligence, but they’re also busy people, and probably not unlike yourself, need something to make it worth their while.
Conventional marketing wisdom says to offer a $25 Amazon gift card raffle – or, in your case, maybe $25 in credit for product or services.
And that’s fine. You can do that. You should. But unless you’re willing to put up a lot of incentive, the reality is that while surveys should be your first stop for identifying customer needs, they’ll rarely be enough.
For that, we need to turn to our next step.
#2. Conduct audience research with a third-party platform
Let’s say you have enough respondents in step one to act on it. If so, that’s fantastic, and you could consider skipping this step.
But I’m going to guess that you didn’t, or you know you won’t because you’re not the kind of person to take surveys, either.
When that happens and you need to learn more about your target customers without weeks or months to spare, PickFu is here to help.
Let me show you how it’s done.
#2a. How to run a customer needs discovery poll with PickFu ( + starter question)
First, just like before, start by signing up for an account with PickFu.
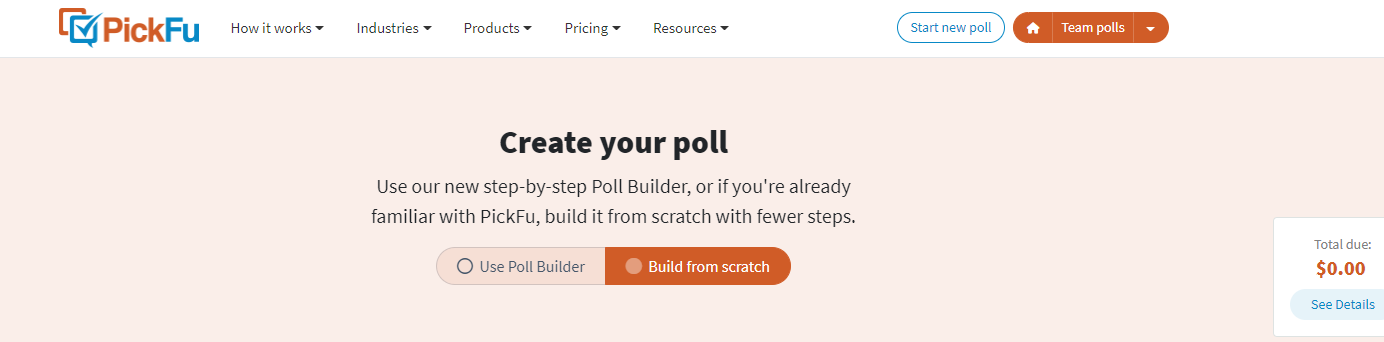
Once you’re logged in and confirmed, the top of your screen should look something like this. Click “start new poll”. Don’t worry – we’re just at the draft stage right now.

Here’s where you’ll land. You have two choices here: you can go with a pre-built poll type or you can build from scratch.
I’m a build-it-from-scratch kind of girl myself, so that’s my default mode. If you’re not, we have a wide variety of templates, sorted by industry. Just take a peek:
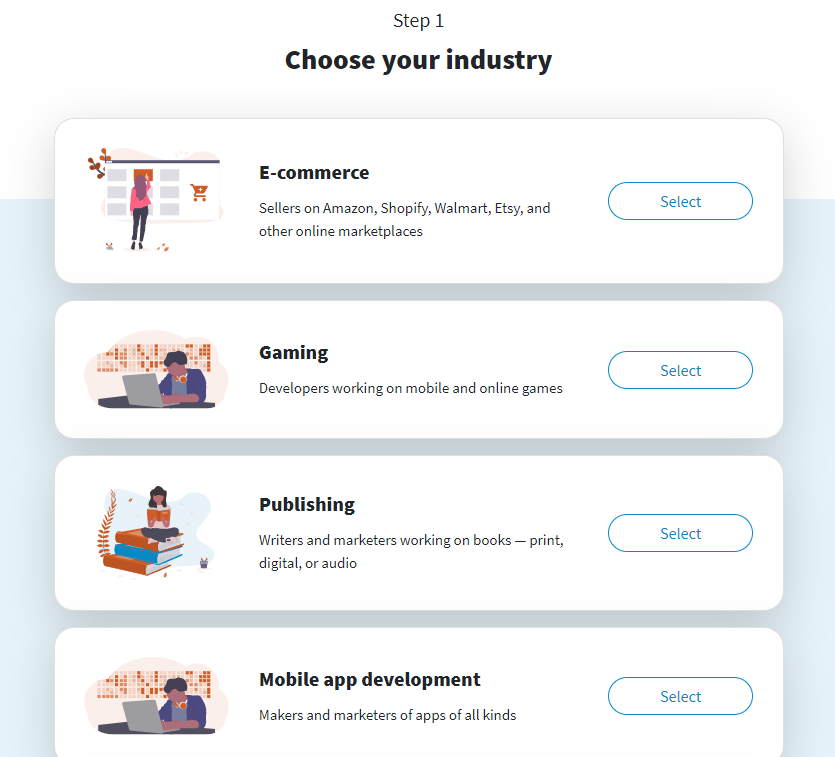
For now, follow along with me and choose “Build from scratch”.
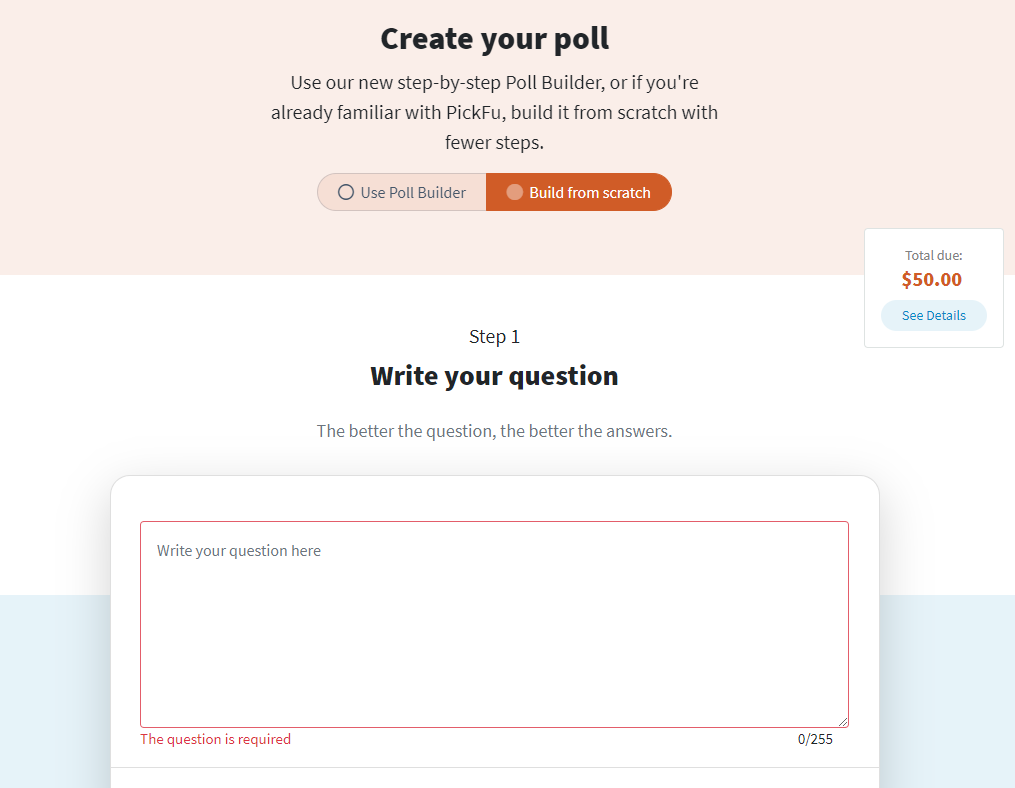
If you’ve run a previous poll, you’ll see the question populate for re-running it. If you have a fresh account, you’ll see the same screen as the above.
Now we need to figure out our magic question.
- Unbiased
- Specific
- A single question (not a double-barreled question)
- Fast to answer
A potential starting question for figuring out customer wants and needs is:
If you could change one thing about [competitor product or own product], what would it be?
If that sounds too general to be useful, don’t worry, we’re getting to that in just a few screens.
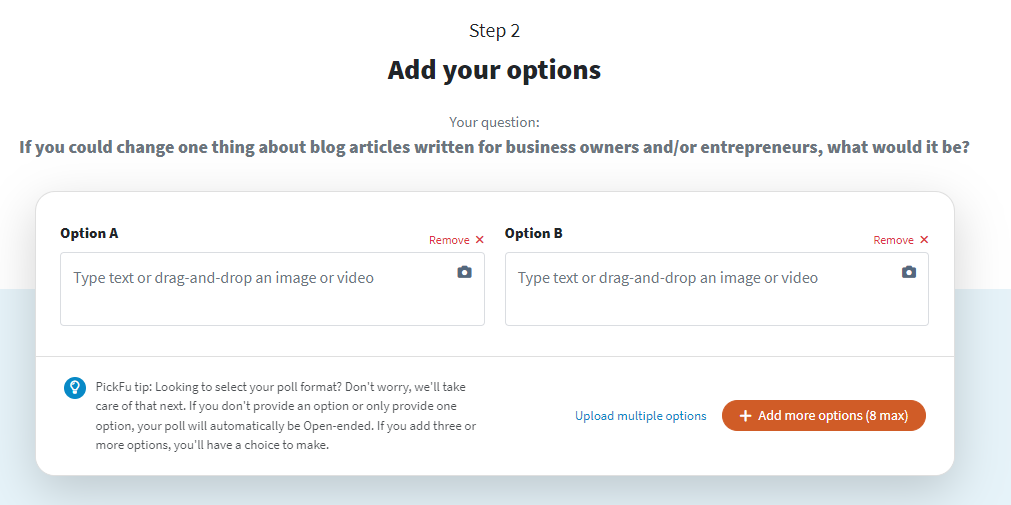
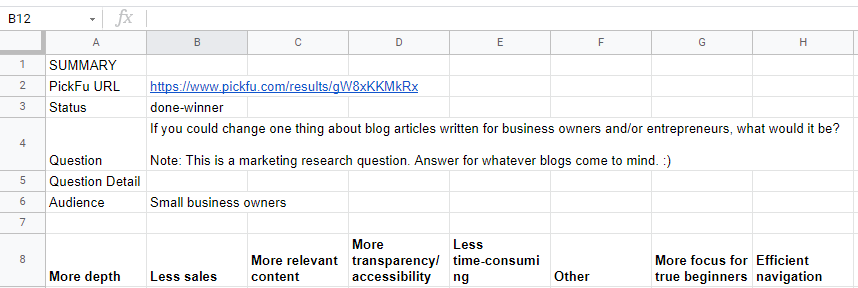
For my goals, I’d love to learn more about what business owners are looking for in blog articles, so this is what my question looks like:
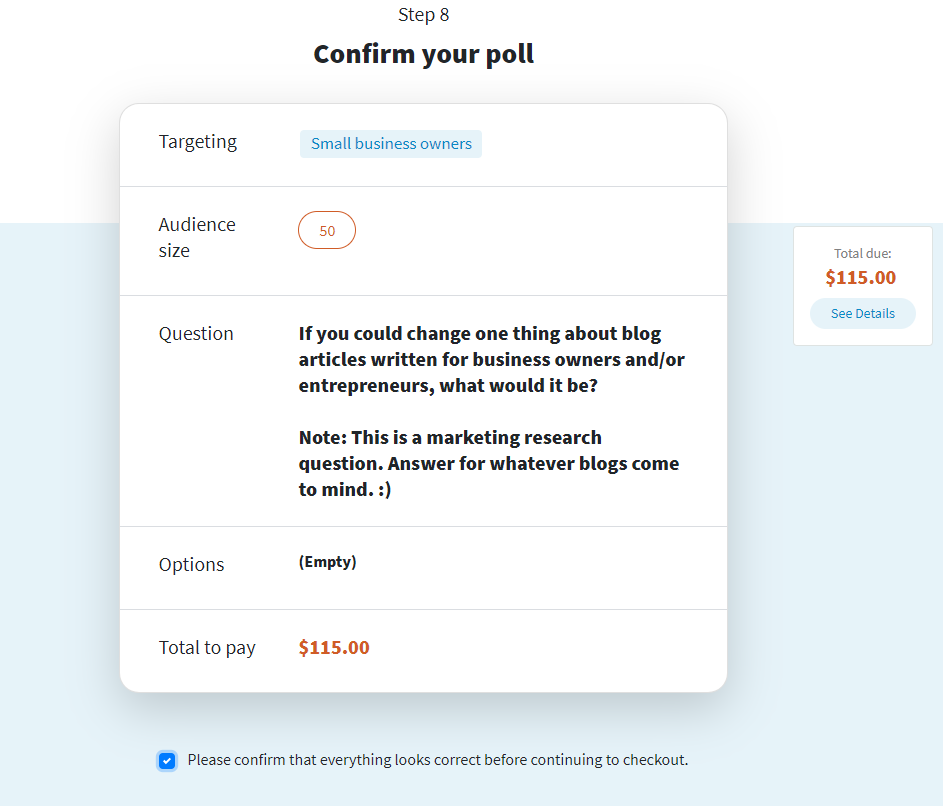
If you could change one thing about blog articles written for business owners and/or entrepreneurs, what would it be?
Note: This is a marketing research question. Answer for whatever blogs come to mind. 🙂
After your question is sorted out, the next step is to choose your answer options. As you add options and fill out your poll, your cart total will update dynamically so there aren’t any surprises at the end.
If you want to use an Open-Ended poll, a Star Rating poll, or run a Click Test, remove one of the options.
If you want to run a Head-to-Head poll to test one option against another, fill out the default two fields.
If you want to run a Ranked poll, click “add more options” until you’ve filled out all potential answers. Each answer will add to your cost, so choose with care, and err to fewer rather than more.
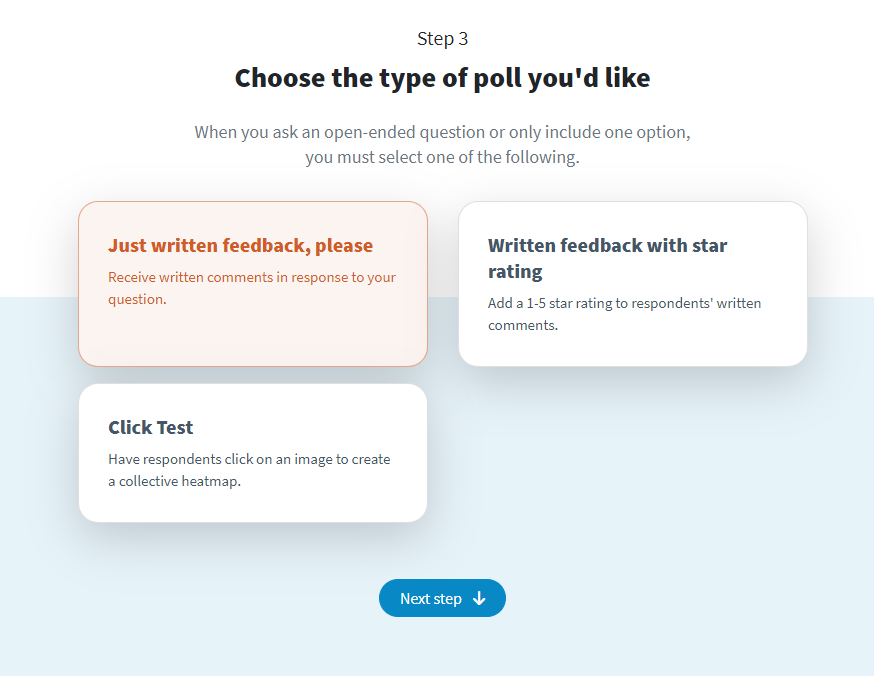
For my purposes, I think this type of question is best as an open-ended poll, so I deleted one option and left it blank.
You’ll be asked what type of poll you’d like to run at the next step. Choose the first option if you’re using my starter question as your formula.
Here is where we get technical. If you’ve chosen to use a general question, you need a custom audience to ensure you’re getting relevant customer insights.
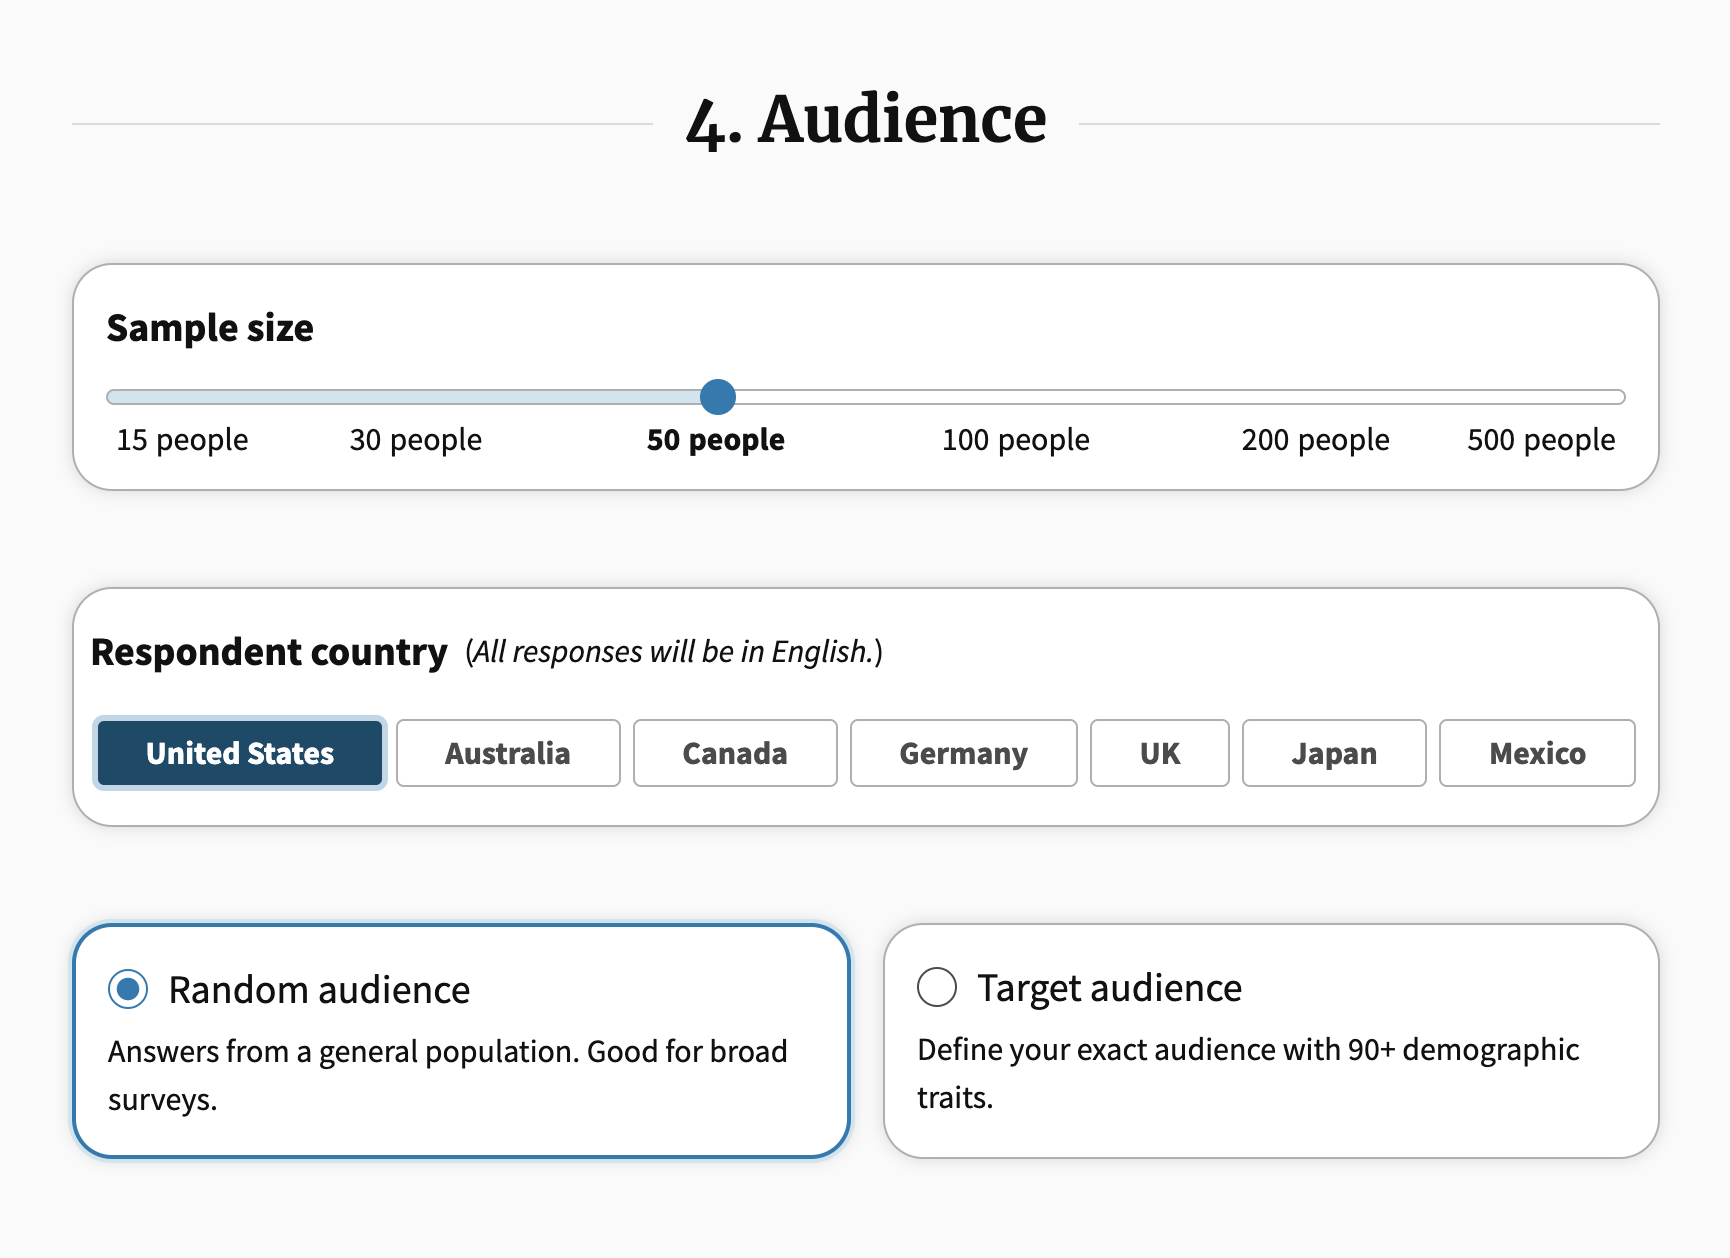
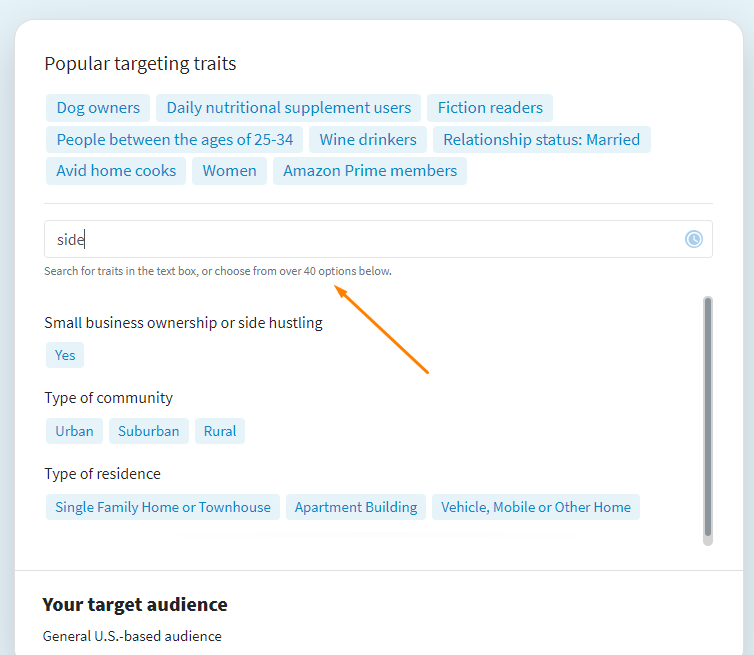
As the screenshot above implies, we have 90+ targeting traits available, depending on what you’re looking for. Whether it’s Amazon Prime shoppers, side-hustlers, or mobile game players, there’s an audience for everyone.
Take a moment to scan through the list or use the search function to find the best audience fit for you.
For me, “small business ownership” is exactly the audience I want to gather more primary data about.
After your audience targeting is sorted, choose your audience size. I recommend starting with 50. Because this poll is targeted, you don’t need more than that to unearth the different types of customer needs in your audience.
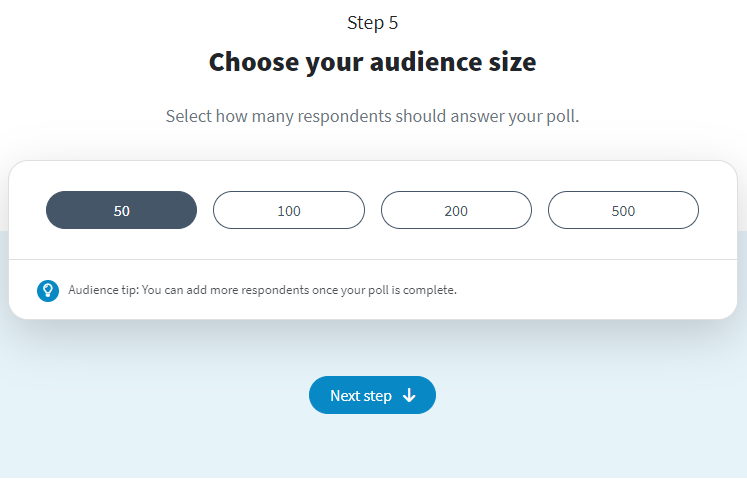
It’ll keep your bills down, and it should be more than enough to build customer-centric products. Even better, those new products should help strengthen your already existing customer relationships, too. Nothing spells customer retention like products people want to use.
Save the big polls for the biggest decisions. For customer research discovery, stick to targeted and small.
After choosing your audience size, proceed to the next screen where you’ll have the option for additional demographics data.
If there’s something you feel is critical to understanding your customers, then I’ll never tell you not to run a poll on it, but if you’re following this guide, you can leave this screen as is. What we’re looking for is in the answers, not the demographics.
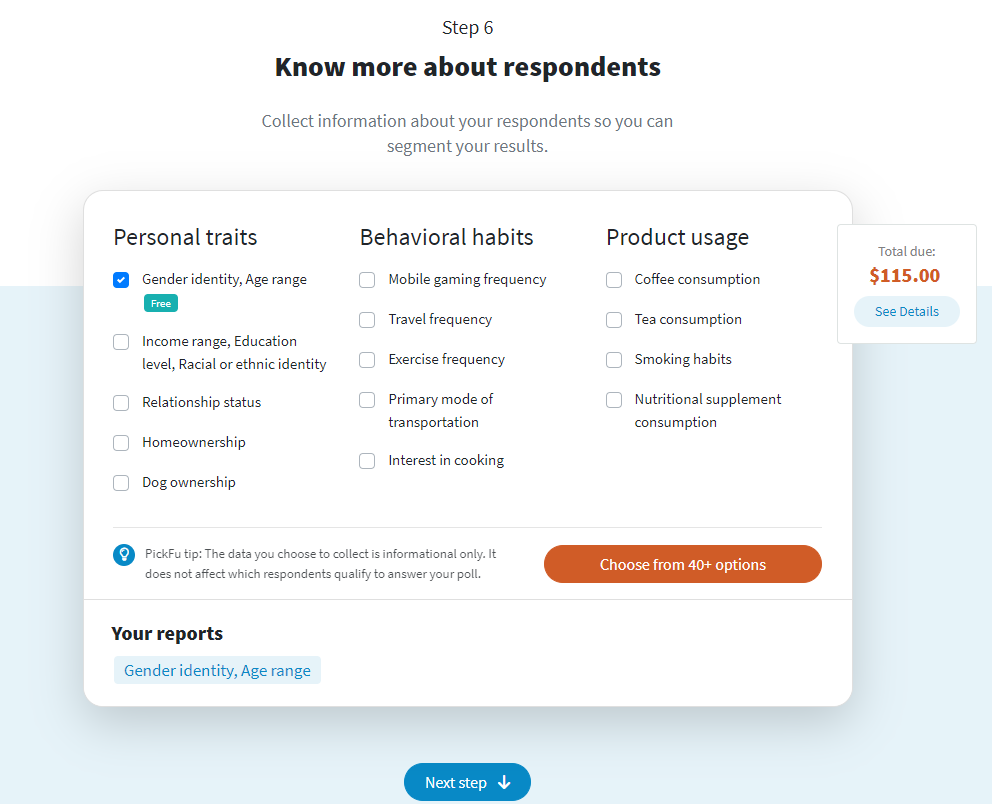
From here, decide if you want a .CSV to play with this information later (it will save you some time, but if you have elbow room, may not be needed) or to save $5 by publishing your poll in our poll gallery.
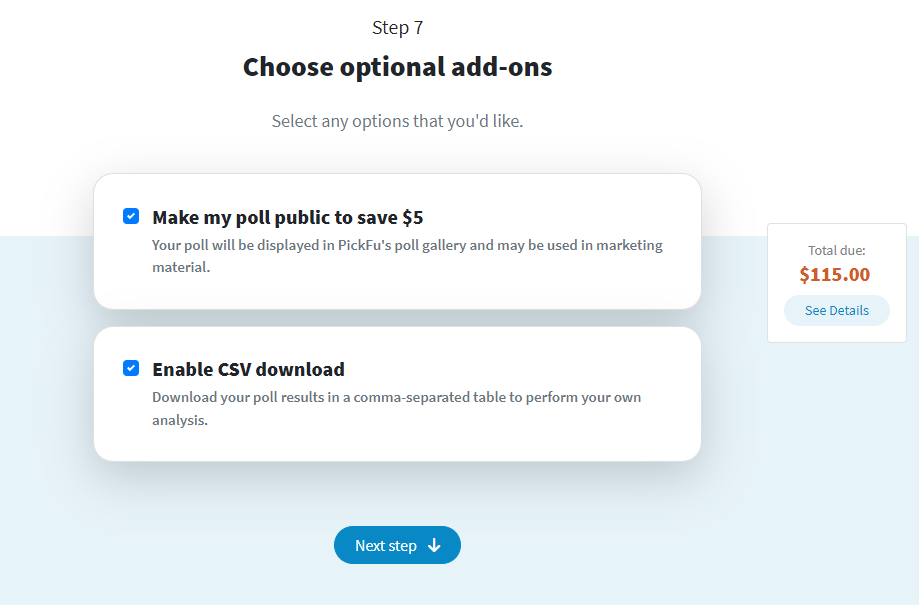
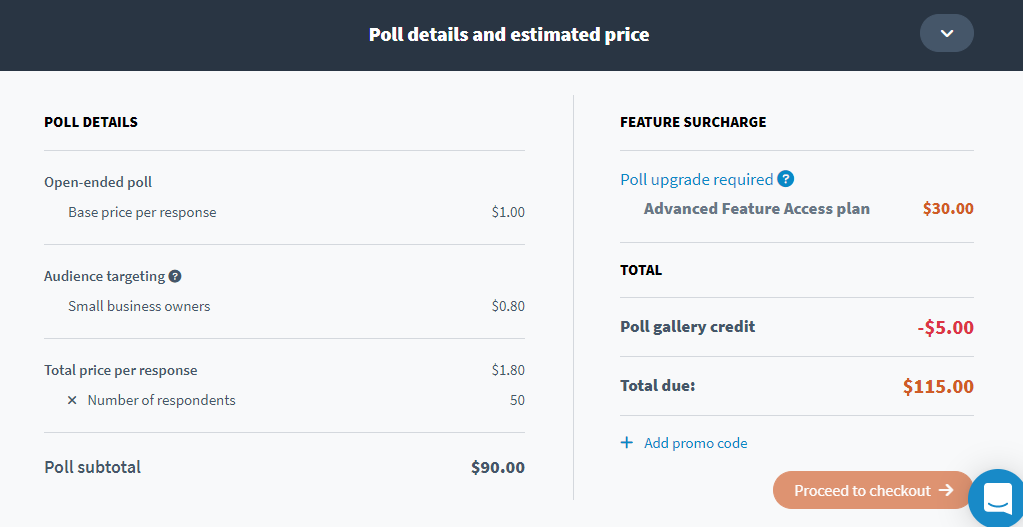
This should bring your total to $115, depending on your specific targeting options and add-ons.
Now all that’s left is our most exciting step: confirming your poll is everything you want it to be and publishing it. Here’s how mine looks at this stage:
Click the big “checkout” button at the bottom. On the last screen, you’ll checkout and review your order.
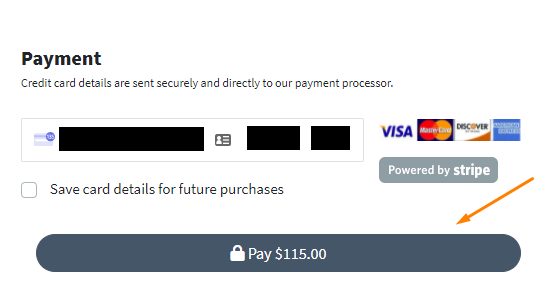
If you’re ready to go, fill in your payment information and click the “pay $X.XX” button. Your poll will launch immediately.
And now we wait while that sweet, sweet customer research rolls in. Most polls come in under an hour, but targeted polls and polls with bigger audiences can take longer.
I chose to run this poll with 100 small business owners, so my poll results took a few hours to come in.
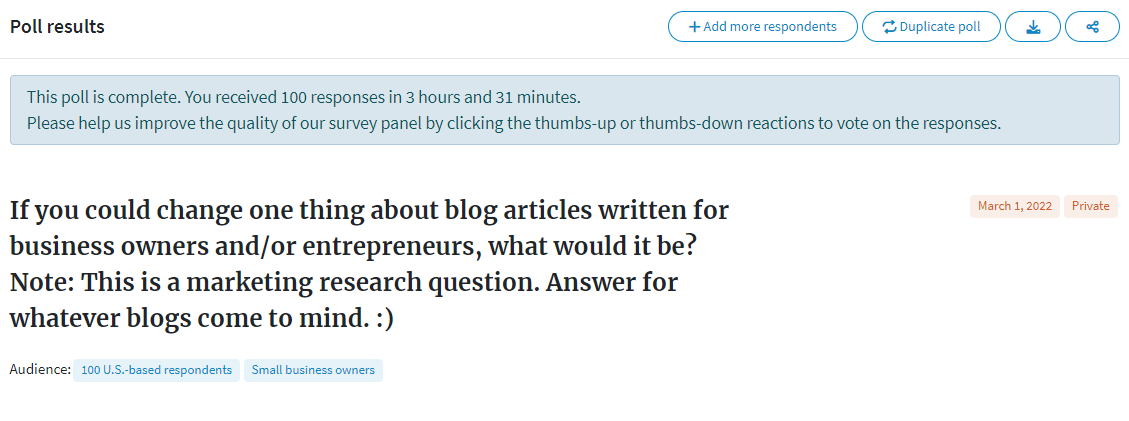
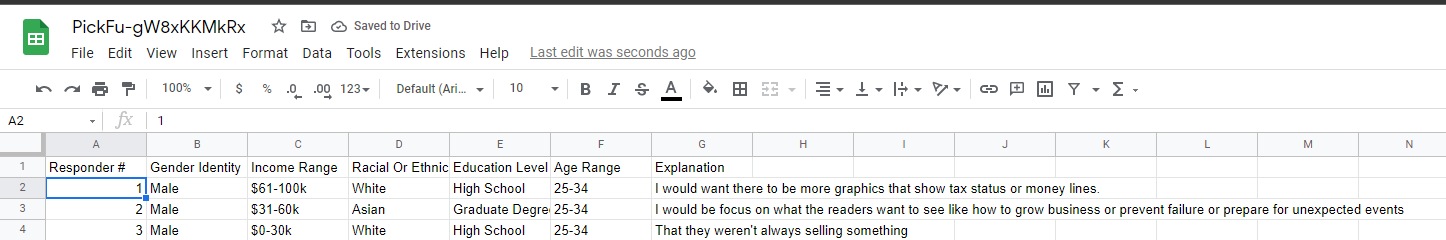
Here’s a preview of what those results were:
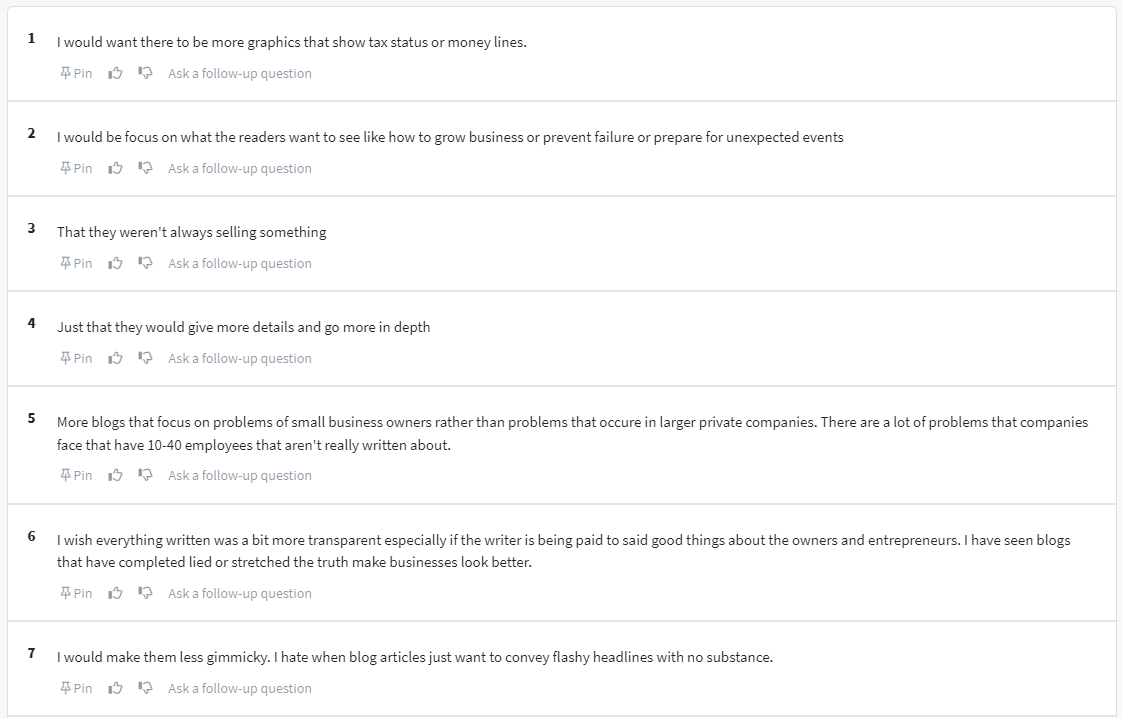
Now, let’s talk about what to do with them.
#2b. How to analyze your customer research from an open-ended poll
This section of the guide assumes you opted for the .CSV. If you didn’t and have an extra hour or two to spare, you should be able to follow along by creating your own spreadsheet.
Likewise, even if you didn’t use PickFu, this method will work for turning any qualitative data into quasi-quantitative numbers and, more importantly, insights you can easily communicate and act on.
First, upload your .CSV to Google Drive so we can take it into Google Sheets. If you don’t already have the file at hand, follow this guide to download your results, then come back to this step.
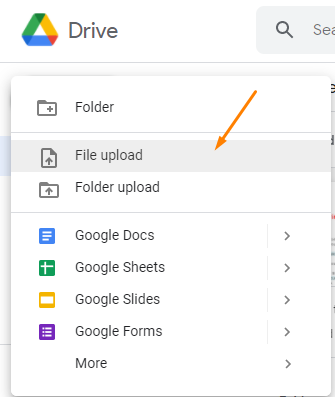
The file name should start with “PickFu”. Mine is “PickFu-gW8xKKMkRx”.
Once it’s uploaded, open the file inside Drive, then click “Open with > Google Sheets”.
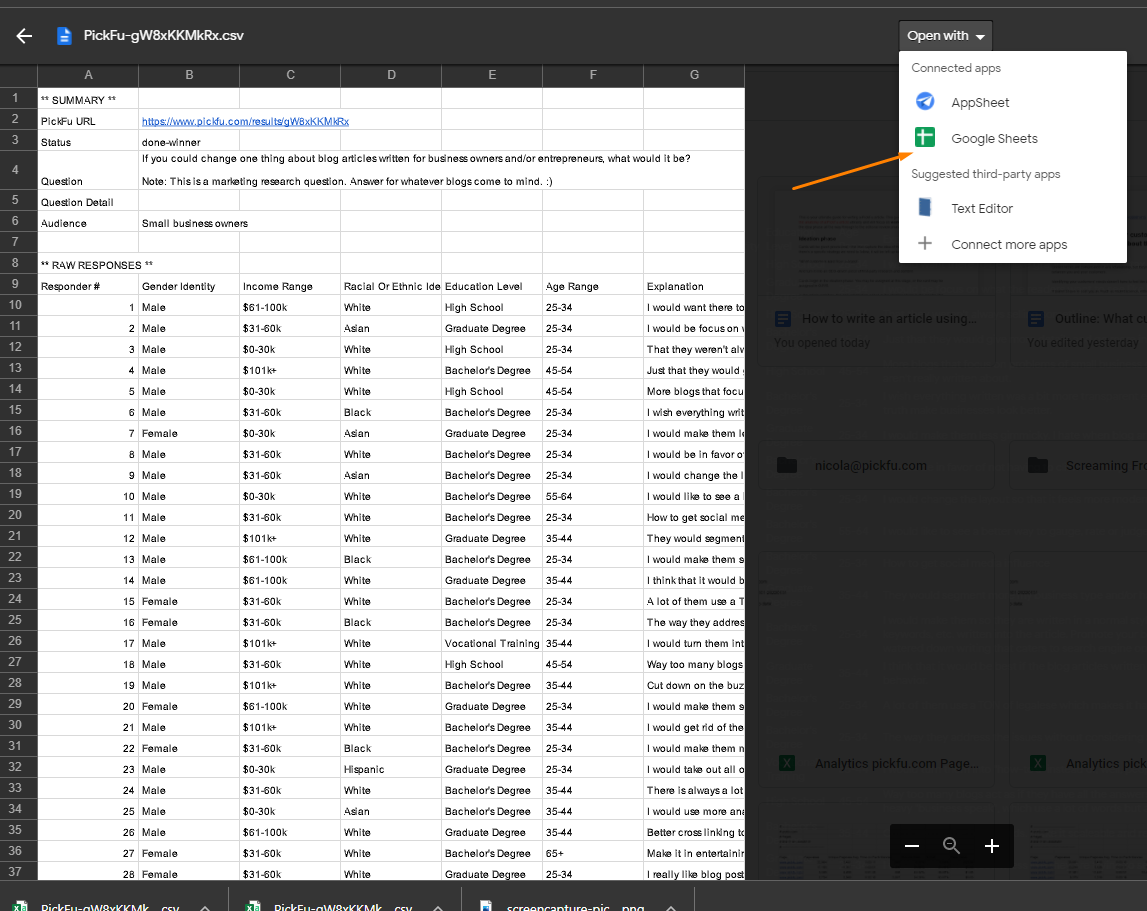
Immediately, it’ll look a lot easier to read. There are still a few things we need to do to set this sheet up for us before we can get into it.
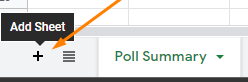
First, rename your file to whatever will be easiest for you to find. Then, create a new tab called “Poll Summary” by clicking the plus symbol at the bottom left of the screen.
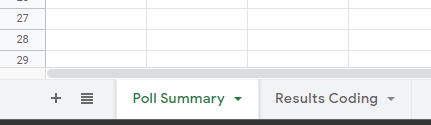
Rename your original working sheet to “Results Coding”. Your tabs should now look like this:
Now, switch to your results coding tab where all of your information is. Select the first eight rows and copy them to your clipboard. Switch back to the poll summary tab and paste them into the blank sheet, then clear those rows from the results coding tab.
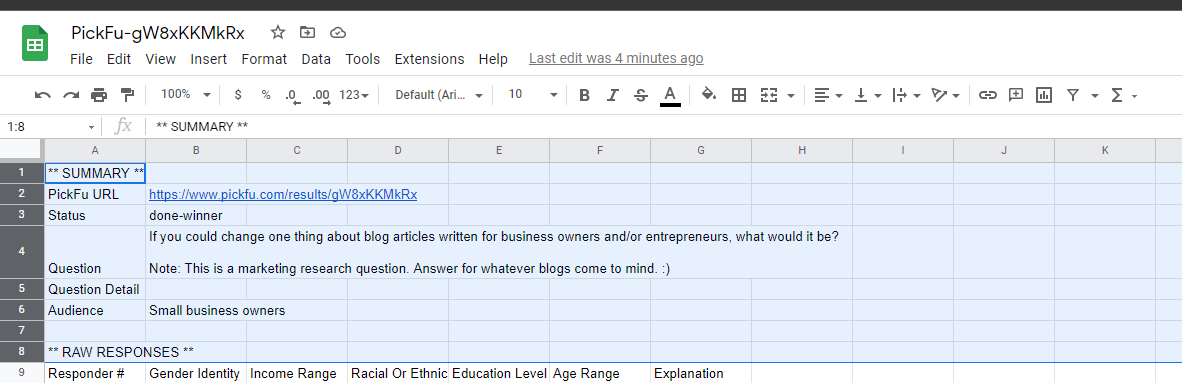
This should leave your sheet looking something like this in your results coding tab:
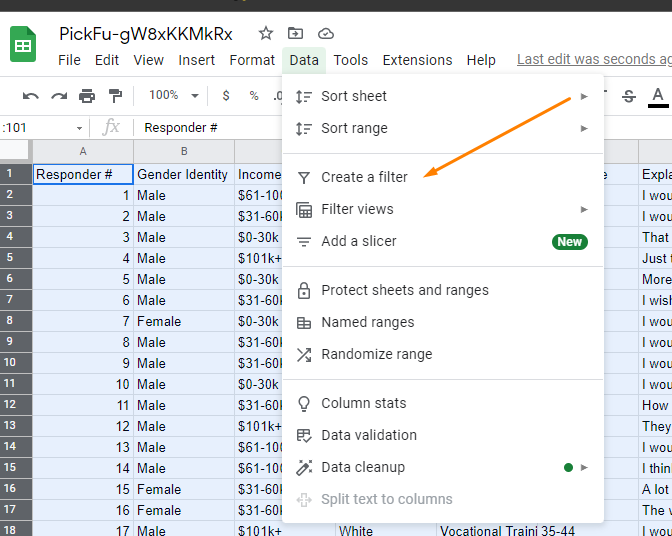
We want to create a filter so we can quickly toggle through the data later. Using the menu at the top of the sheet, navigate to “Data > Create a filter”.
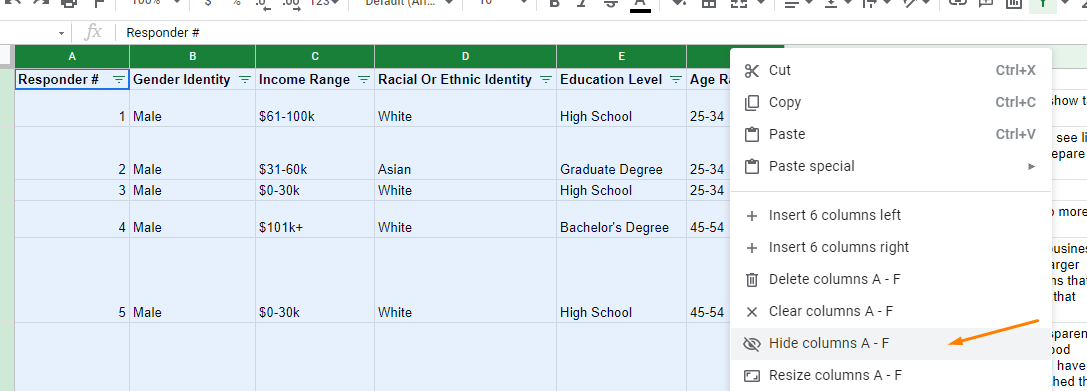
After that, hide any columns you don’t want to see. We’ll need the extra space later. For the analysis I’m currently doing, I don’t need anything but the explanation column, so I hid A-F.
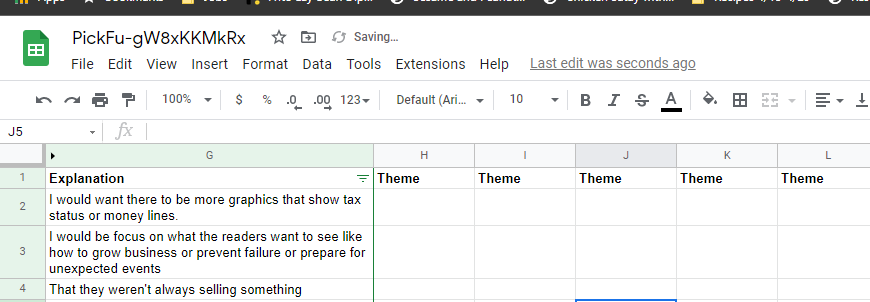
Next, set up a few template columns for yourself to the right side of “explanation”. You can use whatever placeholder word you like. I used “theme”.
From here, set a timer for 5 minutes on your phone, turn off all distractions, and read the responses. Don’t do anything with them yet – just read them and absorb. Look for themes. If your question and audience was specific enough, they should emerge quickly.
A good starting point is to find five themes in 5 minutes. You may end up discovering more than that depending on the size and scope of your research, but start small and err to brevity.
The themes I immediately noticed in my poll results were:
- More depth of topic
- Less sales
- More relevant content
- Less time-consuming
- More transparency/accessibility
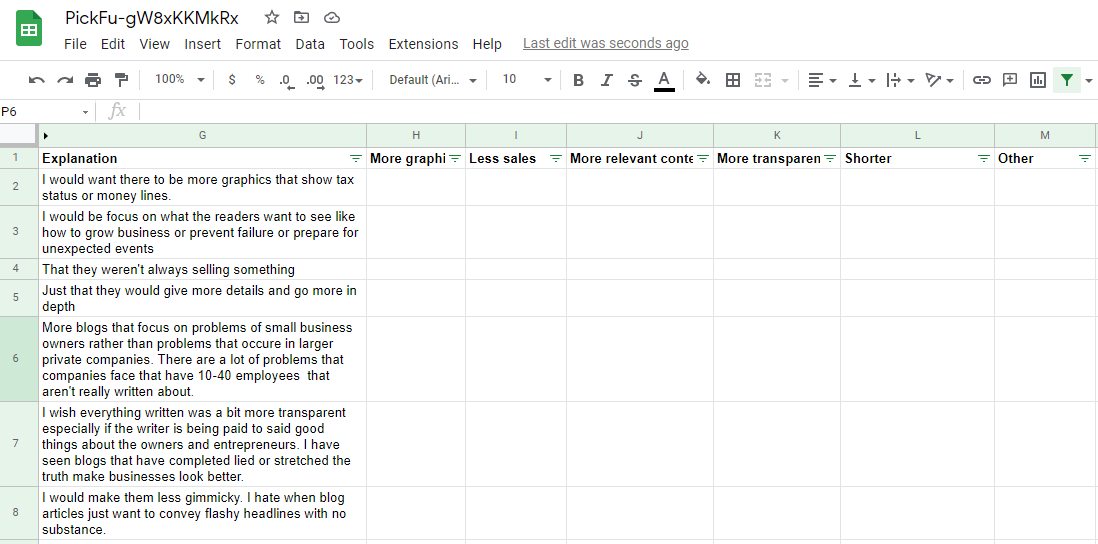
After you’ve settled on themes, change your column names. Then, create one additional column at the end and title it “other”. We’ll come back to why later.
Here’s what it looks like for me so far:
The fun part starts now.
In an ideal world, you have a two- or three-person team that copies the workbook to work on their own copy.
This guide will assume you’re working alone. If you’re not, the same method applies at scale. Have your team follow this guide, then compare their results and settle any disagreements.
At this stage, go through each explanation and, if the answer touches on a theme, put a 1 in the column that corresponds to that theme. Answers can and often will have more than one theme. Just put a 1 in each column it applies to.
(Freezing your top pane will be deeply helpful for this. If you haven’t already done so, select your top row, then go to “View > Freeze > 1 row” to keep the top row locked in place.)
For ~100 short answers, it took me about 20 minutes to go through and code them. Here’s how it looks now:
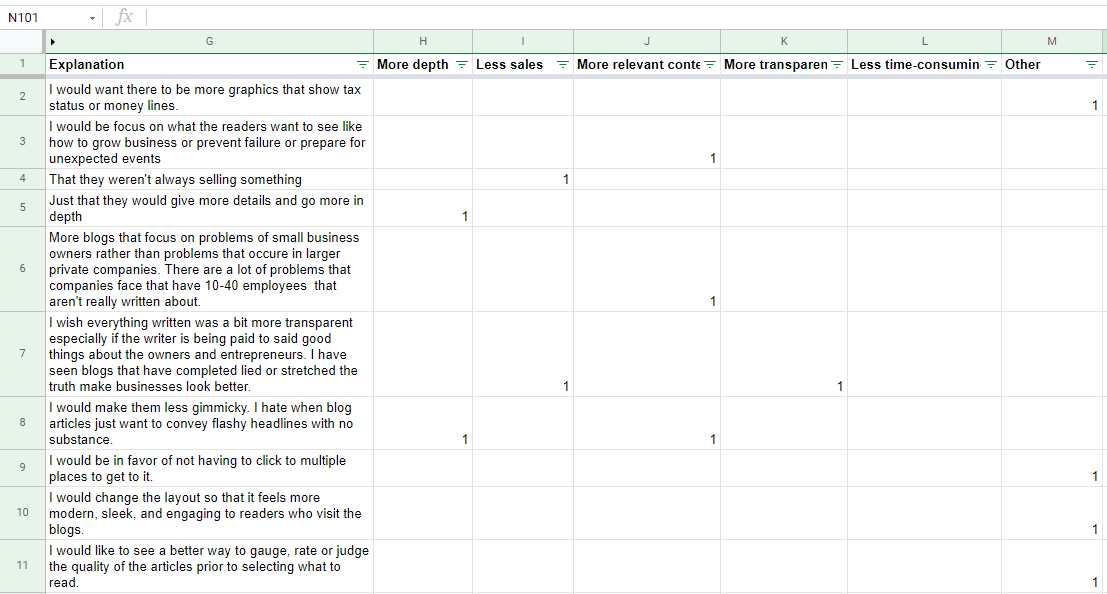
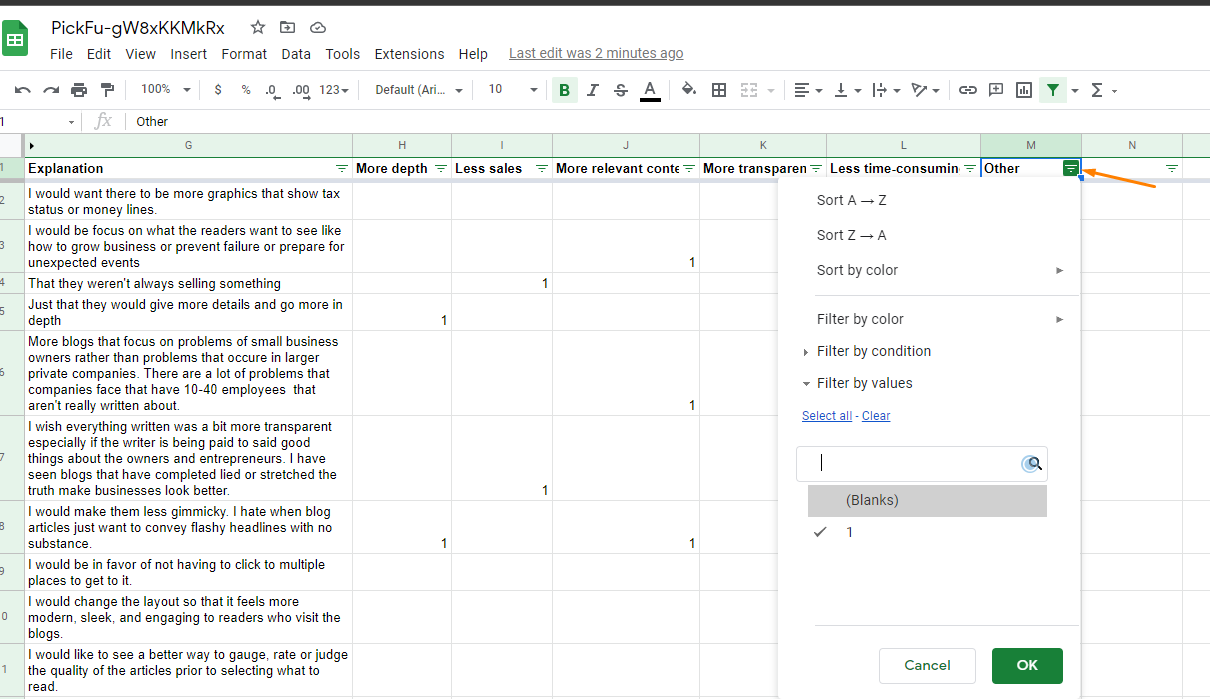
The next thing we’re going to do is investigate our “other” column. If we have a lot of “others”, we might have missed a theme. To see just the entries that were coded with “other”, use the data filter by clicking on the downward triangle in the cell.
Then once you’re there, deselect “blanks”.
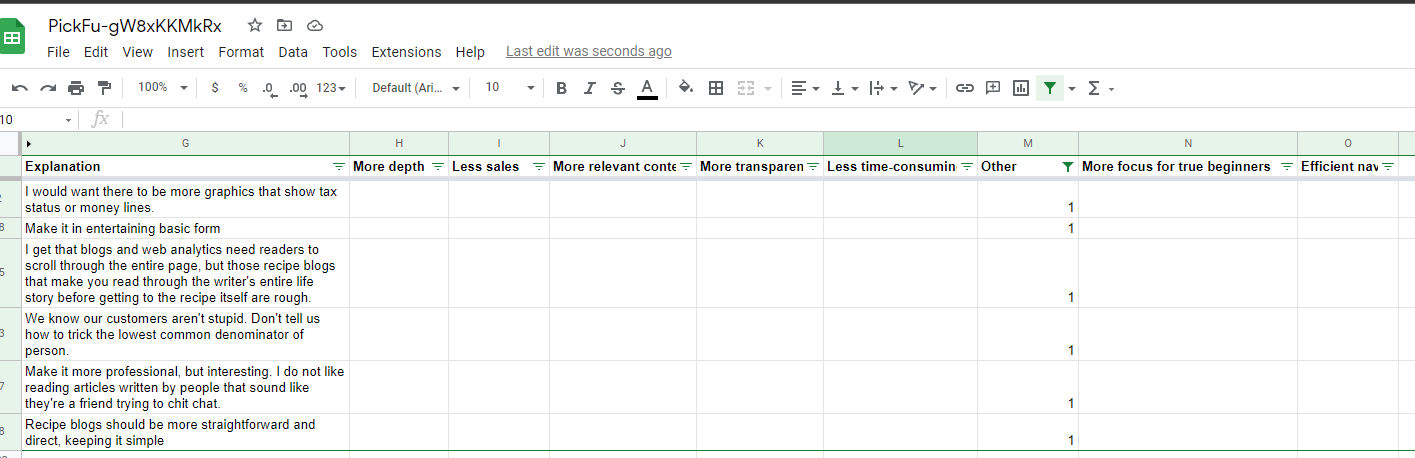
Out of 100 entries, I have 26 that didn’t fall into my original five themes, or surfaced a new potential theme.
Of those 26, 9 fit into an entirely new theme – efficient blog navigation – and 4 fit into a smaller theme. The rest were outliers or could be sorted back into the existing themes. This leaves me with just 6 remaining uncoded entries.
That’s fewer than 10% of my total, so I can discard them and move on. Clear your filters so you’re looking at your sheet unfiltered again, then switch over to your “poll summary” tab.
Copy and paste your theme headers below your summary information. You can use columns or rows – I chose columns.
If you’re using the 50-person poll from this guide, put the following formula into the cell just below your theme header:
=COUNT(‘Results Coding’!H:H)/50
Then, turn on percentage expression by selecting your cell and clicking “format as percent” in the command bar.
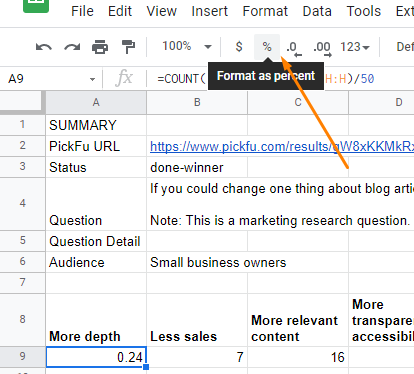
If you’re using a 100-person poll like me, the formula looks like this instead:
=COUNT(‘Results Coding’!H:H)
These numbers are already percentages (they’re expressions out of 100), so there’s no need to use the percentage function.
Copy and paste the formula under each cell. If you’ve followed my setup, it should automatically update the formula to pull in the new data for each theme. If you haven’t, the “H:H” refers to the column where you want it to count.
And that’s it. Here are my final results and what I can read from them now – as well as share with my team:
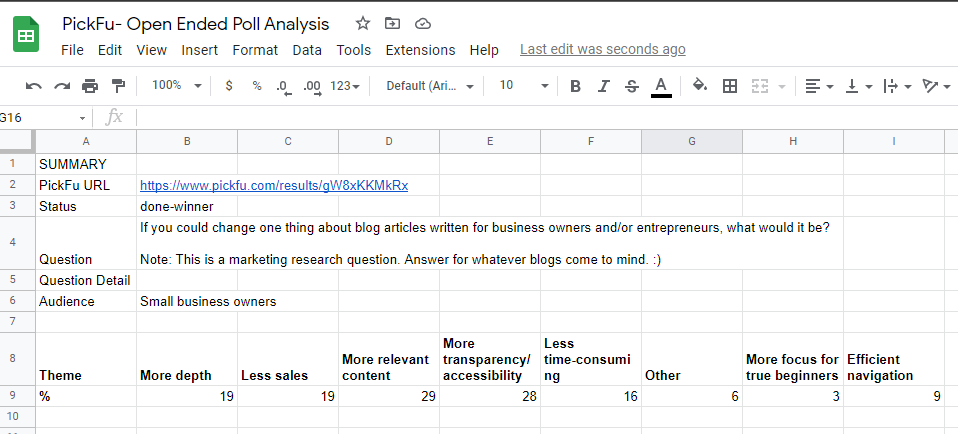
- 19% of small business owners surveyed want more depth on their content and a lot less sales
- 28% want more accessible, transparent language
- 16% want blog posts to stop being so time-consuming relative to the value they provide
- And, most importantly, 29% want more relevant content that doesn’t feel like it’s written for someone else.
That’s a ton of data for me to work with and decisions about our future that just became much easier for me. Hopefully at this point in the guide, you’re in the same place.
OK. If you’ve made it this far, congratulations – you’ve just solved your customer research problem, even if you didn’t use PickFu to do it.
The ultimate point of this step isn’t that you have to use PickFu – it’s that you need to get targeted data from your audience, whether that’s through us or some other means. Then, you need to go through it until it turns into something you can actually work with.
So, regardless of how you got here, once you’ve collected and analyzed your primary data, the final touches to identifying customer needs are setting up social listening and search trend tracking.
#3. Use social listening programs and Google Trends for supplementary data
What makes a good customer experience? Among many other things, anticipating what your customers want before they do.
It sounds impossible. It’s not. In addition to the primary data we gathered in the first two steps, this third step provides effective solutions for supplementing our market research with secondary data.
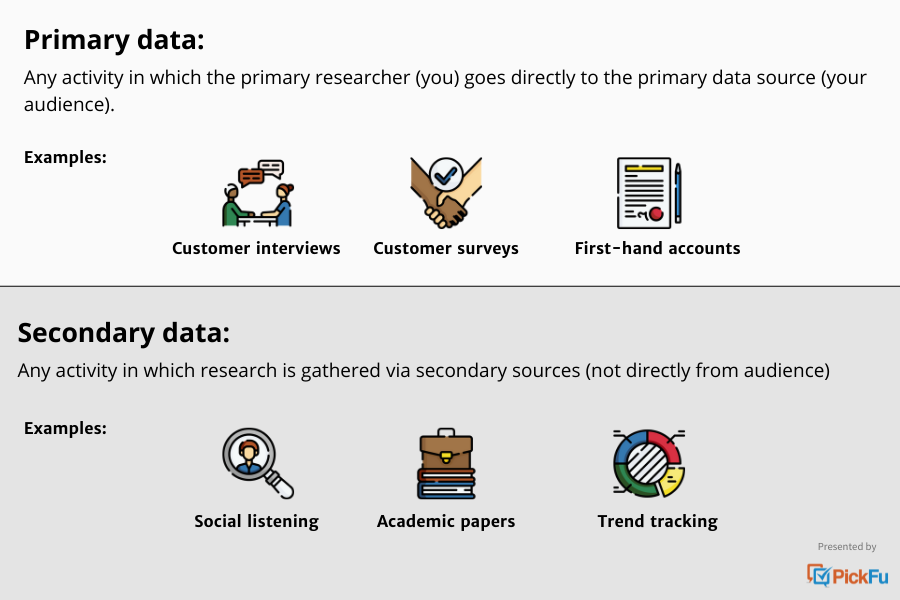
Like the name implies, secondary data is data gathered without direct interactions with your audience. Think of it like academic data. It’s a good starting point, but it’s severely limited, so it should only be used to supplement your primary data.
Secondary data should be used to find untapped needs from your target customers, but not your current customers. I.e., it can’t in any way replace the first two steps of this guide, and is in every sense the cherry on top.
A sundae with just a cherry isn’t a sundae. Secondary research without primary research follows the same rule.
One passive (read: lazy but useful) method of gathering secondary data is through social listening. It’s a little like eavesdropping, but politely.
Social listening, which describes using a program or platform to monitor the social channels in your industry or niche, can produce trending opportunities for your business if you’re willing to take the time to use it.
It can also turn into a rabbit hole, so stay specific about what you’re looking for. I recommend tracking the top five hashtags associated with your target audience so you can stay on top of trends.
If you don’t already have those at hand or want to dig into hashtags more, my favorite tool is Hashtagify. I’ve been a user for years, and it only gets better as time passes. What you can do for free is fairly limited, but still very useful.
Check out the free results for searching “#businessblogs” down below:
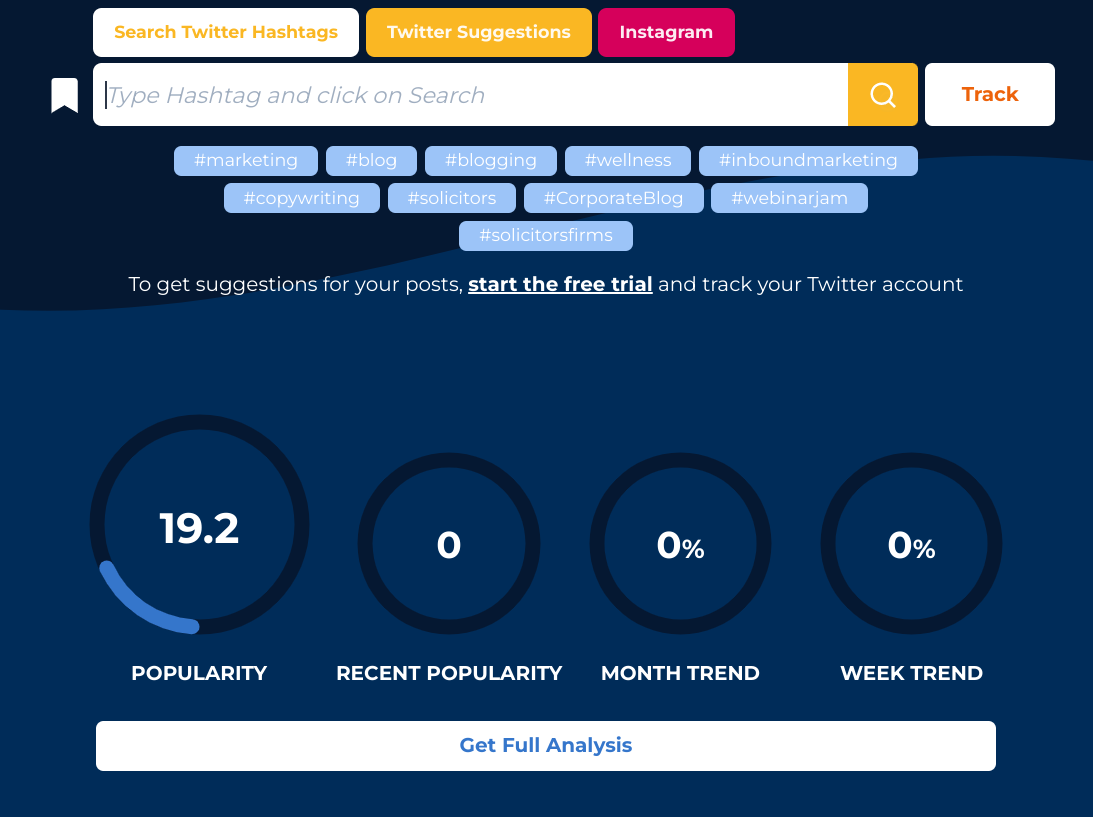
(Looks like I better omit that one from my social strategy.)
Check in once a month to see if new related hashtags have appeared, then follow their trail on their respective platforms. Do you see a theme? Do you notice people saying the same things over and over again?
That’s your cue to follow and start fishing for product opportunities.
As for how to follow, try using a tool like Mention to make tracking your hashtags (and brand mentions) a breeze. It’s free for small accounts, easy to use, and made for busy people.
The gist is that you link your social accounts, set up alerts for certain hashtags or your user and/or brand name, and monitor reports from your dashboard or inbox.
For a deeper guide on social listening, check out this comprehensive look at how to get started with Mention.
If Mention isn’t your speed, Hootsuite is also a popular alternative with a free plan.
Regardless of which tool you use, don’t sleep on social listening. Your competitors probably aren’t.
Emarketer reports that third-party sources of consumer research have become the leading source of rapid information for marketers since the pandemic started, and just second to that is social listening platforms.
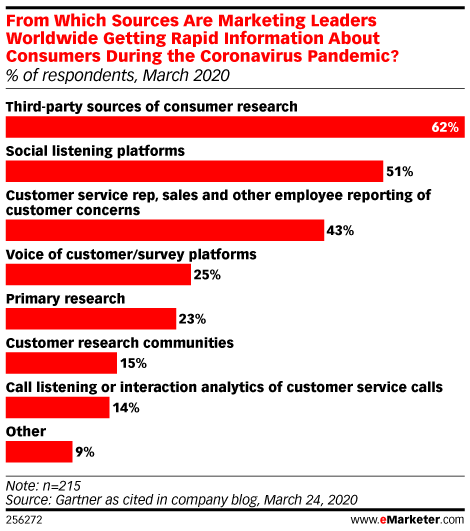
Over half of the top-performing marketers use social listening platforms. Interestingly, only 23% do their own primary research. (Like I mentioned before, it’s hard to get enough engagement with it alone, even with incentives.)
But what does this all mean for you? You may not be a marketer. Probably not.
Here’s my take: if you’re in business, you’re in marketing.
The only difference is whether you’re conscious of being a marketer or not. If you have something to sell, you have a marketing problem, and if there’s anyone who knows how to solve those problems, it’s the people who responded to that survey.
You may not want to be them, but you definitely want to perform like them.
Let’s say that you’re not such a fan of social media or social listening though. I’m not either for subjective reasons, and since it’s secondary data, we can afford to be a little choosy.
Google Trends can be another source of insight, albeit extremely top level, to peer inside the mind of a market.
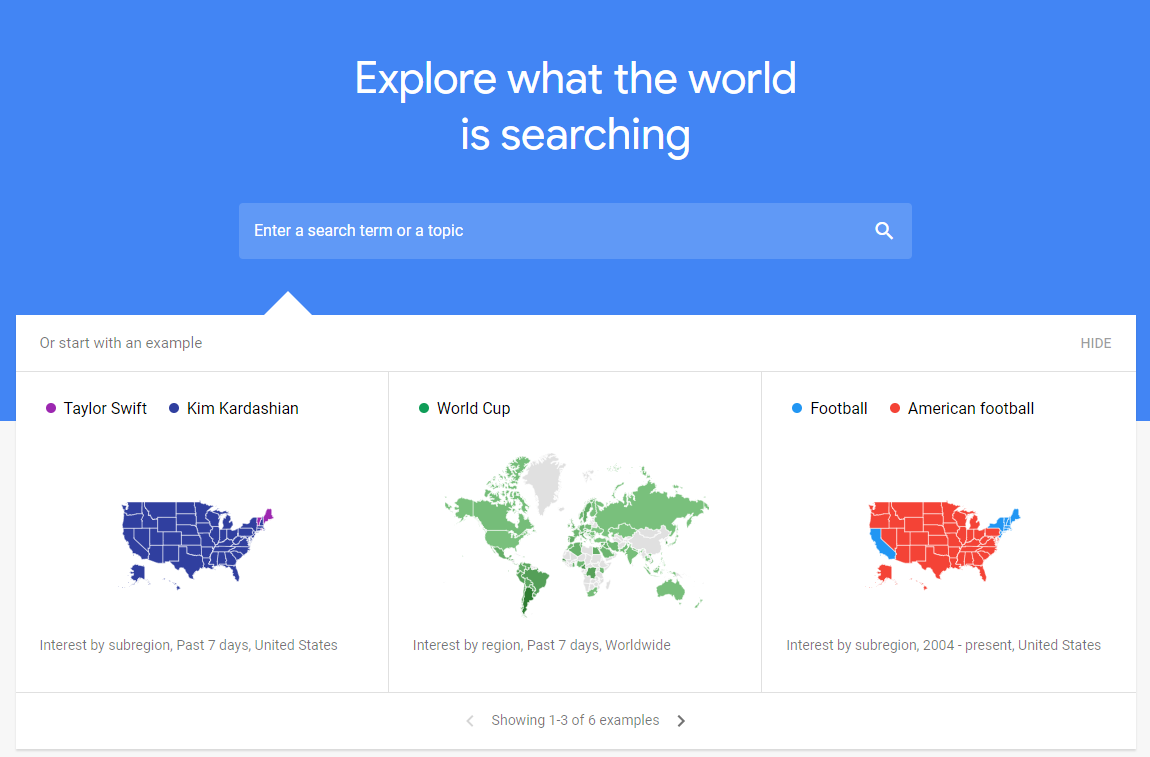
Using it is as simple as using the search engine itself. Unlike search engine optimization tools that rely on scraped, potentially old data, Google Trends gives you real-time data on the way people are searching.
Google sees 5.6 billion searches a day. That’s a lot of charts and trends just waiting for the intrepid searcher – you – to untangle them.
Start your search around the product ideas and loose threads left over from running your poll. What were your big themes? Can you translate those into a search term? If so, plug it in and watch the search engine magic happen.
Besides looking at current trends, you can also see the historical trends behind different keywords, something important for physical products with a lot of virality. Do you remember fidget spinners? They were the hottest thing on the market – for about two months.
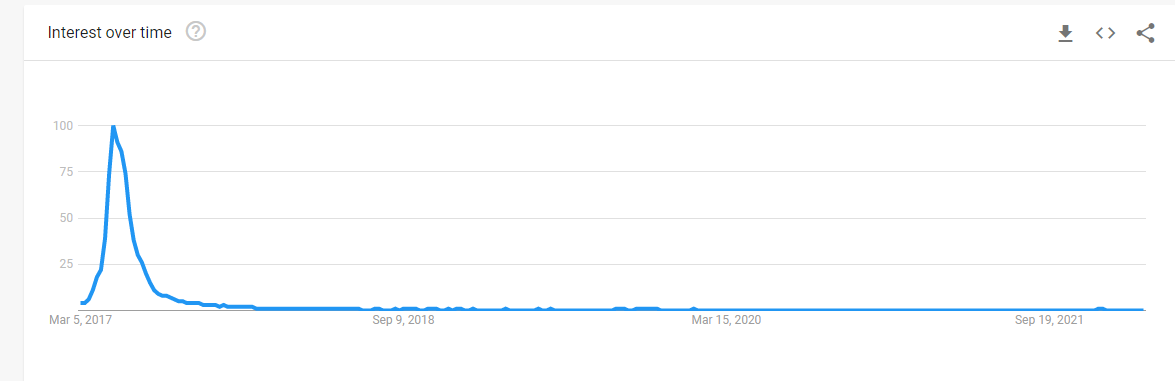
Suffice to say, the trend line isn’t looking up to its heyday for fidget spinners. In an ideal world, the retailers stocking them had access to Google Trends to see the fall as it happened, but alas, we’ll never know.
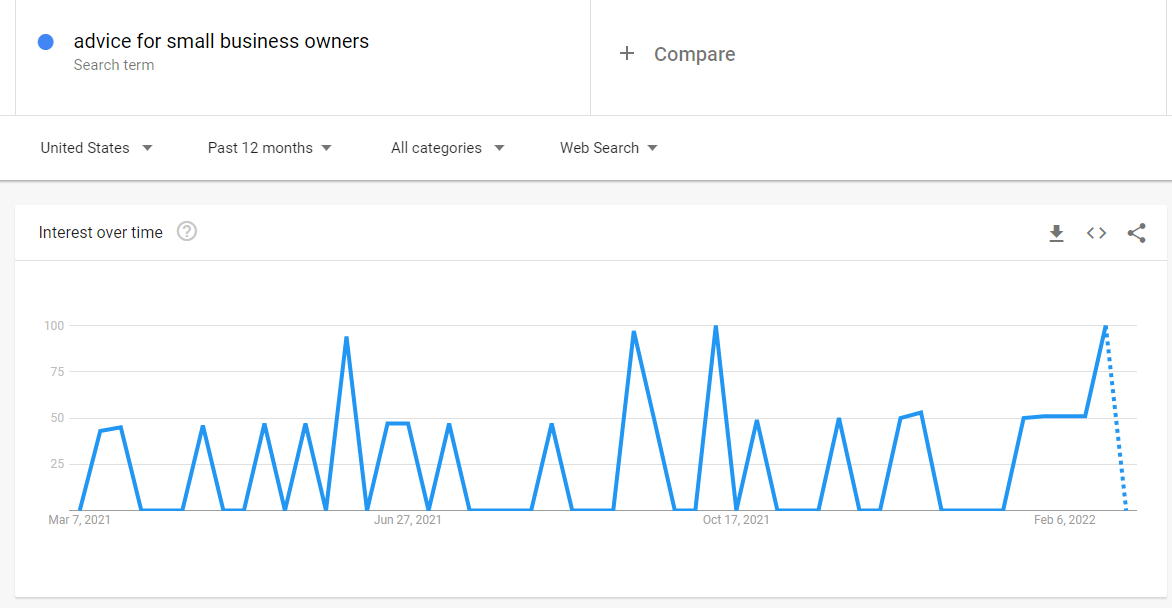
But let’s take a more practical example. Following with my earlier example, let’s see what the interest level in business blogs is over the last five years:
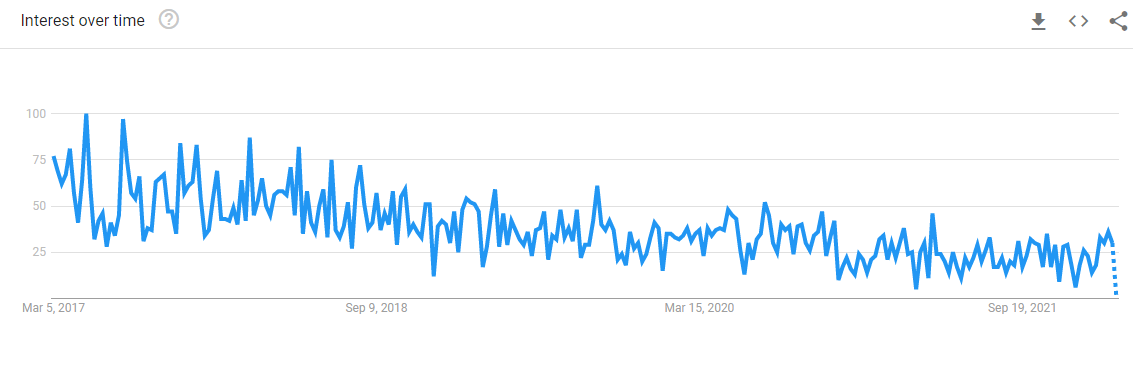
Definitely some ups and down, but I’m certainly on a safer path than with fidget spinners. People are still searching for “business blogs”, but the trend indicates that they’re likely no longer searching for them with that particular keyword.
If I wanted to pursue this further, my goal would be to narrow in on the way my customers talk about blogs and check the trends against it.
As a rule of thumb, aim to audit Google Trends at least once a quarter. Set up a calendar reminder and a recurring meeting with yourself for a few hours every few months.
You’ll be glad you did, and so will your future new customers when it leads to better, more innovative products.
Bottom line:
Secondary data won’t take the cake for you, but it can add a lot on top of it. Use social listening and Google Trends to keep your eye on the market and stockpile your customer research with the latest trends.
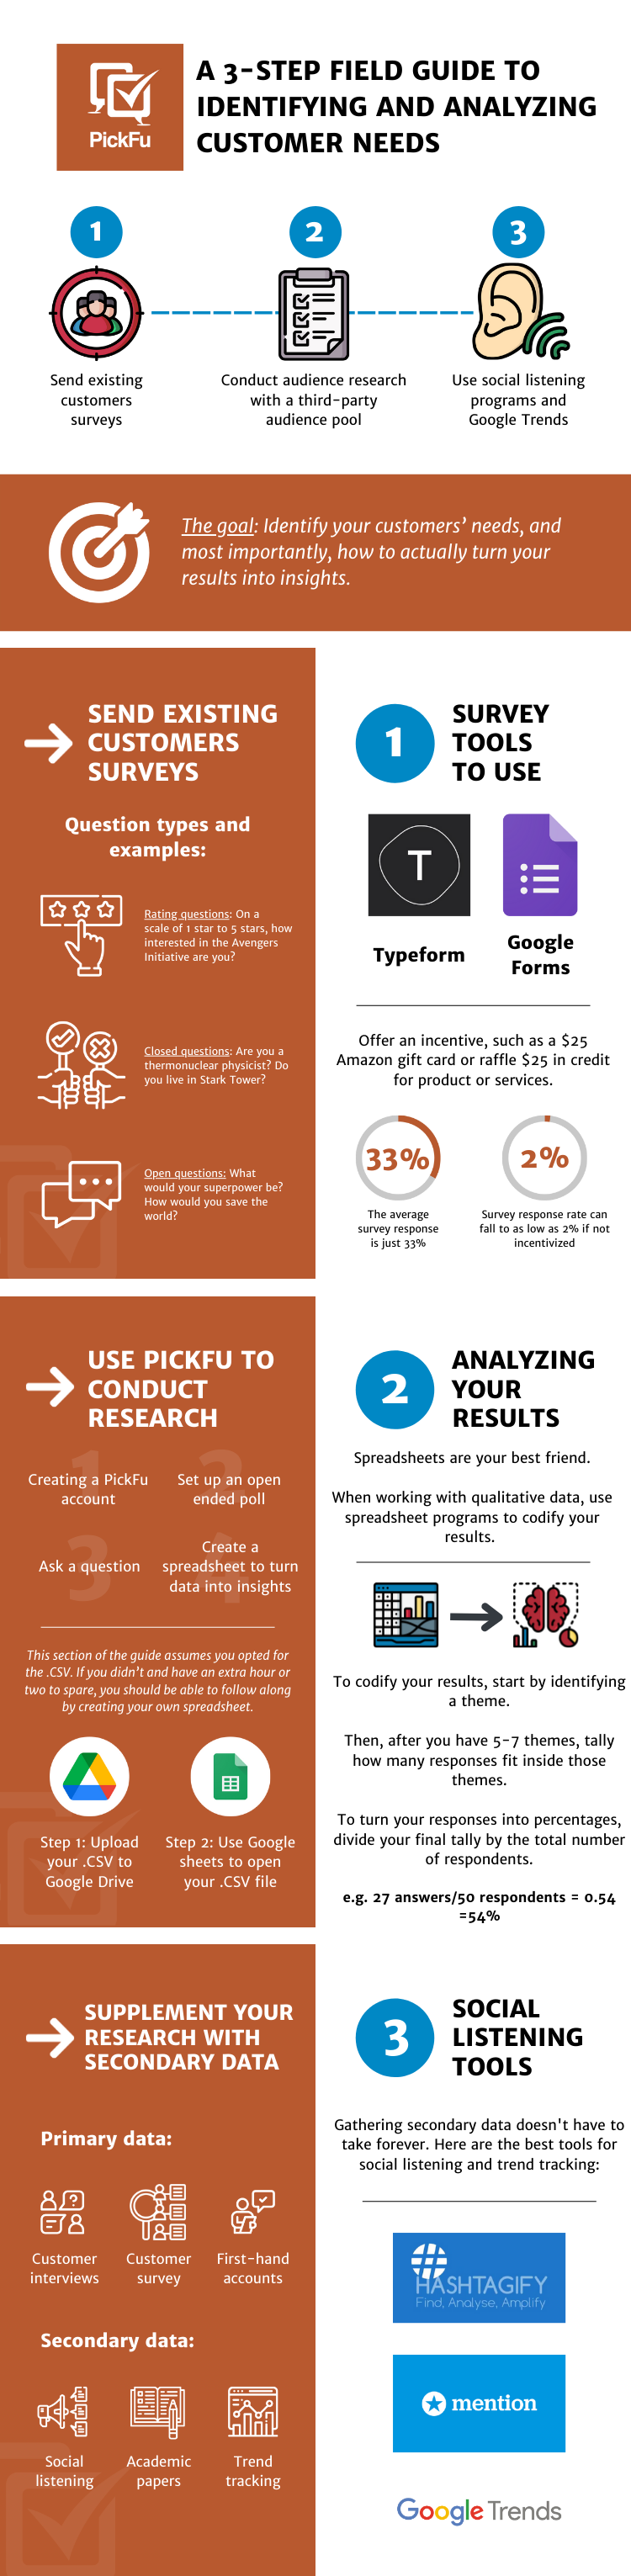
Infographic: Discovering and understanding customer needs in 3 steps
More of a visual learner or looking for a quick reference for how to identify customer needs? We’ve got you covered.
TL;DR: Identify customer needs in three straightforward, real-world steps
Meeting customer needs starts with identifying them. Here are three real-world steps for discovering unmet customer needs, no matter what stage of the customer journey you’re targeting:
- Survey your existing customers. They’ll be your highest source of customer data, but expect to incentivize participation, and anticipate having a lot of gaps.
- Poll a third-party, targeted audience. Third-party consumer research is now the go-to source for rapid information from marketing leaders worldwide. PickFu is fast, cost-effective, and straightforward. Run your customer needs poll today and get results back before dinner (or second dinner).
- Round out your customer insights with secondary data from social listening and trend tracking. These aren’t robust forms of customer data, but there are still valuable insights to be found.
They say knowing is half the battle, and when it comes to meeting customer needs, they’re absolutely right. Don’t hesitate to reach out to us if there are any questions we can help you with for tackling your first customer need poll, and good luck out there.